
The Boundary Blur#
The Slack thread had been going for three hours. A machine learning model was failing in production, but nobody could agree whose responsibility it was to fix it. The data engineer insisted the pipeline was delivering clean data on schedule. The ML engineer pointed to model performance metrics that looked normal in development. The analytics engineer questioned whether the feature transformations matched what the business logic required. Meanwhile, the platform engineer wondered why nobody had configured proper monitoring for the model serving infrastructure.
This scene repeats daily in organizations where role boundaries remain unclear and handoff points lack definition. Teams with overlapping skills and adjacent responsibilities often struggle to coordinate effectively, leading to duplicated effort, gaps in ownership, and finger-pointing when systems fail. The problem isn’t technical competence, it’s organizational design that treats data work as a single discipline when it actually requires coordinated specialization.
Modern data organizations need multiple engineering roles working in concert, each with distinct responsibilities and clear interfaces. When these boundaries are well-defined, teams move faster and build more reliable systems. When they’re fuzzy, even talented engineers waste time on coordination overhead and blame assignment instead of solving business problems.
The Specialization Dividend#
When role boundaries and handoffs are designed thoughtfully, data teams achieve remarkable efficiency gains. Data engineers focus on reliable infrastructure and data movement. Analytics engineers concentrate on business logic and metrics consistency. ML engineers optimize model performance and deployment reliability. Platform engineers enable self-service capabilities and operational excellence. Each role amplifies the others through clear interfaces and shared standards.
The business impact is measurable: faster time-to-insight, more reliable data products, and reduced operational overhead. Teams spend their energy building new capabilities rather than coordinating existing ones. Technical debt accumulates more slowly because each role maintains its area of expertise. Incident response becomes faster because ownership is clear and escalation paths are well-defined.
When boundaries are poorly defined, the costs compound quickly. Engineers duplicate work across roles, creating inconsistent implementations and maintenance burdens. Critical capabilities fall through gaps between teams. Simple changes require coordination across multiple groups, slowing delivery and increasing error rates. The promise of data-driven decision-making becomes a source of organizational friction rather than competitive advantage.
The Four Pillars of Data#
Data engineers own the infrastructure and pipelines that make data available for downstream consumption. They focus on extraction, loading, storage, and the foundational transformations that prepare raw data for analysis. Their work emphasizes reliability, scalability, and operational excellence in data movement and storage systems.
Analytics engineers bridge the gap between raw data and business insights. They own the business logic, metric definitions, and data models that transform clean data into analysis-ready formats. Their work emphasizes correctness, consistency, and usability of data for business decision-making. They typically work closest to business stakeholders and understand domain-specific requirements.
ML engineers specialize in deploying, serving, and monitoring machine learning models in production environments. They focus on model performance, inference latency, and the operational aspects of ML systems. Their work emphasizes reliability and scalability of model serving infrastructure, feature engineering for production use cases, and monitoring model behavior over time.
Platform engineers build the tools, infrastructure, and developer experience that enable other engineering roles to be productive. They focus on automation, self-service capabilities, and operational tooling that reduces manual overhead across the data organization. Their work emphasizes developer productivity, system reliability, and operational efficiency.
The Assembly Line Model#
Think of data team roles like a manufacturing assembly line, but for information products instead of physical goods. Each station has specialized equipment and expertise optimized for specific tasks. Raw materials flow between stations through well-defined interfaces. Quality control happens at each stage to catch problems early. The final product emerges from coordinated work across multiple specialists.
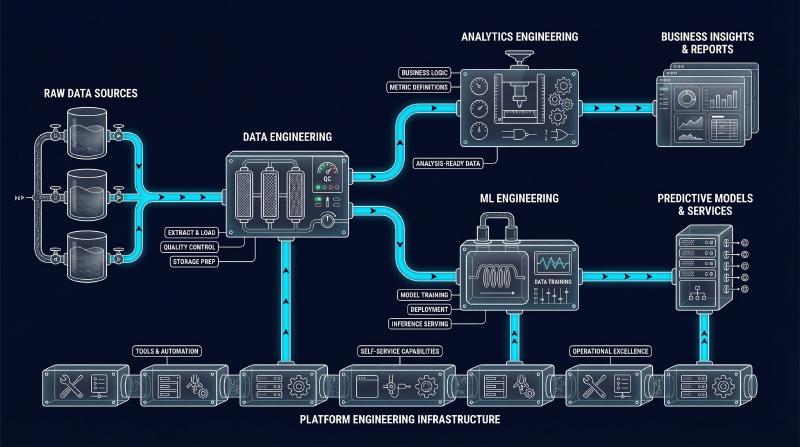
Data engineers operate the receiving dock and material preparation stations. They ensure raw materials arrive on schedule, meet quality standards, and are prepared for downstream processing. Analytics engineers run the assembly stations where business logic is applied and products take their final form. ML engineers operate specialized production lines for predictive products that require different tooling and quality controls.
Platform engineers maintain the factory infrastructure—the conveyor belts, power systems, and automation that keeps everything running smoothly. They build tools that help other stations operate more efficiently and consistently. When problems occur, clear ownership means the right specialist can respond quickly without disrupting other operations.
This manufacturing analogy clarifies why interfaces matter more than individual capabilities. A brilliant machinist can’t compensate for unreliable material delivery. Excellent quality control can’t fix fundamental design problems. The system succeeds when each station does its job well and hands off clean work to the next stage. Coordination happens through standards and interfaces, not constant communication.
The Ownership Protocol#
Determining role ownership for data work requires evaluating three dimensions: data lifecycle stage, technical specialization, and business proximity. Most conflicts arise when these dimensions point to different roles, requiring explicit decisions about which factor takes priority.
%%{init: {'theme':'base', 'themeVariables': {'fontSize': '18px', 'fontFamily': 'arial', 'primaryColor': '#e3f2fd', 'primaryTextColor': '#000', 'primaryBorderColor': '#1976d2', 'lineColor': '#1976d2'}, 'flowchart': {'nodeSpacing': 50, 'rankSpacing': 80}}}%%
flowchart TD
    A["Data Work
    Assignment"] --> B{"Data Lifecycle
    Stage?"}

    B -->|"Extract, Load,
    Storage"| C["Data
    Engineering"]
    B -->|"Business Logic,
    Metrics"| D["Analytics
    Engineering"]
    B -->|"Model Training,
    Deployment"| E["ML
    Engineering"]
    B -->|"Tools, Developer
    Experience"| F["Platform
    Engineering"]

    C --> G{"Technical
    Specialization?"}
    D --> G
    E --> G
    F --> G

    G -->|"Distributed Systems,
    Infrastructure"| H["Confirm Data/Platform
    Engineering"]
    G -->|"Statistical Methods,
    Domain Knowledge"| I["Confirm Analytics/ML
    Engineering"]

    H --> J{"Business
    Proximity?"}
    I --> J

    J -->|"High Stakeholder
    Interaction"| K["Analytics
    Engineering"]
    J -->|"Internal Engineering
    Focus"| L["Data/Platform
    Engineering"]
    J -->|"Production Systems
    Focus"| M["ML/Platform
    Engineering"]

    style A fill:#1976d2,stroke:#0d47a1,stroke-width:3px,color:#fff
    style B fill:#f57c00,stroke:#ef6c00,stroke-width:2px,color:#fff
    style G fill:#f57c00,stroke:#ef6c00,stroke-width:2px,color:#fff
    style J fill:#f57c00,stroke:#ef6c00,stroke-width:2px,color:#fff

    style C fill:#388e3c,stroke:#2e7d32,stroke-width:2px,color:#fff
    style D fill:#388e3c,stroke:#2e7d32,stroke-width:2px,color:#fff
    style E fill:#388e3c,stroke:#2e7d32,stroke-width:2px,color:#fff
    style F fill:#388e3c,stroke:#2e7d32,stroke-width:2px,color:#fff

    style H fill:#e8f5e8,stroke:#388e3c,stroke-width:2px
    style I fill:#e8f5e8,stroke:#388e3c,stroke-width:2px
    style K fill:#e8f5e8,stroke:#388e3c,stroke-width:2px
    style L fill:#e8f5e8,stroke:#388e3c,stroke-width:2px
    style M fill:#e8f5e8,stroke:#388e3c,stroke-width:2px
Data lifecycle stage provides the primary filter. Work that involves extracting data from source systems, ensuring reliable delivery, or managing storage infrastructure typically belongs to data engineering. Work that applies business logic, defines metrics, or creates analysis-ready datasets usually falls to analytics engineering. Work that involves model training, deployment, or inference optimization belongs to ML engineering. Work that builds tools, automation, or developer experience belongs to platform engineering.
Technical specialization offers the secondary consideration. Some tasks require deep expertise in specific technologies or methodologies that align with particular roles. Distributed systems optimization typically requires data engineering skills. Statistical modeling and experimentation design usually need analytics engineering knowledge. Model serving and MLOps require ML engineering expertise. Infrastructure automation and developer tooling need platform engineering capabilities.
Business proximity provides the final factor. Work that requires frequent interaction with business stakeholders or deep domain knowledge often belongs to analytics engineering, regardless of technical complexity. Work that primarily serves internal engineering needs typically belongs to platform engineering. Work that focuses on system reliability and operational concerns usually belongs to data or ML engineering.
Case Study: The Generalist Trap#
Hypothetical example: A growing fintech company initially had one “data team” that handled everything from ETL pipelines to machine learning models to business reporting. As the company scaled, this team became a bottleneck for every data-related request. The team spent most of their time in meetings coordinating work and explaining why simple requests took weeks to complete.
The company restructured into specialized roles with clear handoff points. Data engineers owned the pipelines that extracted transaction data and made it available in the data warehouse. Analytics engineers owned the business logic that calculated customer metrics and risk scores. ML engineers owned the fraud detection models and their deployment infrastructure. Platform engineers built self-service tools that allowed business users to create simple reports without engineering involvement.
The transformation took six months and required significant investment in documentation, tooling, and process design. However, the results were dramatic: time-to-delivery for new analytics requests dropped from weeks to days, model deployment became routine rather than a major project, and the engineering teams could focus on their areas of expertise rather than constant context-switching.
This pattern appears across organizations that successfully scale data capabilities. The transition from generalist to specialist roles happens when coordination overhead exceeds the benefits of flexibility. Organizations that recognize this transition early can design clear interfaces and avoid the technical debt that accumulates when role boundaries remain undefined.
The Interface Blueprint#
Begin by mapping current responsibilities across your data organization. Document who currently handles data extraction, transformation, modeling, deployment, and operational tasks. Identify areas where multiple people do similar work or where critical tasks lack clear ownership. This inventory reveals where role clarification can add the most value.
%%{init: {'theme':'base', 'themeVariables': {'fontSize': '18px', 'fontFamily': 'arial', 'primaryColor': '#e3f2fd', 'primaryTextColor': '#000', 'primaryBorderColor': '#1976d2', 'lineColor': '#1976d2'}, 'flowchart': {'nodeSpacing': 50, 'rankSpacing': 80}}}%%
flowchart TD
    A["Step 1: Map Current
    Responsibilities"] --> B["Step 2: Define Interface
    Contracts"]
    B --> C["Step 3: Establish
    Shared Standards"]
    C --> D["Step 4: Create
    Escalation Paths"]
    D --> E["Step 5: Measure
    Effectiveness"]

    A --> A1["Document current owners,
    Identify duplicate work,
    Find ownership gaps,
    Assess coordination overhead"]

    B --> B1["Data formats & quality,
    Delivery schedules,
    Handoff procedures,
    SLA definitions"]

    C --> C1["Naming conventions,
    Documentation requirements,
    Monitoring practices,
    Automated enforcement"]

    D --> D1["Decision-making authority,
    Conflict resolution,
    Communication rhythms,
    Incident response"]

    E --> E1["Delivery velocity,
    Coordination time,
    Interface reliability,
    Team satisfaction"]

    style A fill:#1976d2,stroke:#0d47a1,stroke-width:3px,color:#fff
    style B fill:#1976d2,stroke:#0d47a1,stroke-width:3px,color:#fff
    style C fill:#1976d2,stroke:#0d47a1,stroke-width:3px,color:#fff
    style D fill:#1976d2,stroke:#0d47a1,stroke-width:3px,color:#fff
    style E fill:#1976d2,stroke:#0d47a1,stroke-width:3px,color:#fff

    style A1 fill:#e8f5e8,stroke:#388e3c,stroke-width:2px
    style B1 fill:#fff3e0,stroke:#f57c00,stroke-width:2px
    style C1 fill:#f3e5f5,stroke:#7b1fa2,stroke-width:2px
    style D1 fill:#e8f5e8,stroke:#388e3c,stroke-width:2px
    style E1 fill:#fff3e0,stroke:#f57c00,stroke-width:2px
Next, define interface contracts between roles based on data flow and dependencies. Specify what data engineers deliver to analytics engineers, what analytics engineers provide to ML engineers, and what platform engineers build for everyone else. Include data formats, quality standards, delivery schedules, and escalation procedures in these contracts.
Establish shared standards that enable clean handoffs between roles. Define common data formats, naming conventions, documentation requirements, and monitoring practices. These standards reduce the coordination overhead that typically accompanies role specialization. Invest in tooling that enforces standards automatically rather than relying on manual compliance.
Create clear escalation paths for issues that span multiple roles. Define who makes decisions when requirements conflict across teams. Establish regular communication rhythms that keep teams aligned without requiring constant coordination. Design incident response procedures that activate the right expertise quickly.
Finally, measure the effectiveness of role boundaries through delivery velocity and coordination overhead. Track how long requests take to move between teams and how much time engineers spend in cross-team coordination. Adjust boundaries and interfaces based on what actually improves outcomes rather than theoretical organizational design.
Metrics of Flow#
Success in multi-role data organizations is measured through interface reliability and delivery velocity rather than individual team metrics. Track how consistently teams meet their handoff commitments to downstream consumers. Monitor the time required for work to flow between roles and identify bottlenecks that slow overall delivery.
%%{init: {'theme':'base', 'themeVariables': {'fontSize': '18px', 'fontFamily': 'arial', 'primaryColor': '#e3f2fd', 'primaryTextColor': '#000', 'primaryBorderColor': '#1976d2', 'lineColor': '#1976d2'}, 'flowchart': {'nodeSpacing': 50, 'rankSpacing': 80}}}%%
flowchart TD
    A["Multi-Role Success Metrics"] --> B["Interface Reliability"]
    A --> C["Delivery Velocity"]
    A --> D["Leading Indicators"]
    A --> E["Resilience Measures"]

    B --> B1["Data quality: > 99.5%,
    Delivery timeliness: > 95%,
    Format consistency: 100%,
    Handoff success rate: > 98%"]

    C --> C1["End-to-end cycle time,
    Request-to-production flow,
    Cross-team coordination time,
    Bottleneck identification"]

    D --> D1["Communication volume,
    Escalation frequency,
    Rework rates,
    Planned vs reactive coordination"]

    E --> E1["Cross-training coverage,
    Graceful degradation,
    Knowledge documentation,
    Backup capabilities"]

    style A fill:#1976d2,stroke:#0d47a1,stroke-width:3px,color:#fff
    style B fill:#388e3c,stroke:#2e7d32,stroke-width:2px,color:#fff
    style C fill:#388e3c,stroke:#2e7d32,stroke-width:2px,color:#fff
    style D fill:#388e3c,stroke:#2e7d32,stroke-width:2px,color:#fff
    style E fill:#388e3c,stroke:#2e7d32,stroke-width:2px,color:#fff

    style B1 fill:#e8f5e8,stroke:#388e3c,stroke-width:2px
    style C1 fill:#fff3e0,stroke:#f57c00,stroke-width:2px
    style D1 fill:#f3e5f5,stroke:#7b1fa2,stroke-width:2px
    style E1 fill:#e8f5e8,stroke:#388e3c,stroke-width:2px
Interface reliability includes data quality, delivery timeliness, and format consistency at handoff points. Data engineers should deliver clean, well-documented datasets on schedule. Analytics engineers should provide stable metric definitions and business logic. ML engineers should maintain model performance and availability. Platform engineers should ensure tool reliability and developer productivity.
Delivery velocity measures how quickly new requirements flow through the entire system from request to production deployment. This end-to-end metric captures the effectiveness of role coordination better than individual team productivity measures. Watch for increasing cycle times that indicate coordination problems or unclear ownership.
Leading indicators include cross-team communication volume, escalation frequency, and rework rates. Healthy role boundaries reduce the need for constant coordination while maintaining clear escalation paths for exceptional cases. Monitor how often teams need to involve other roles to complete their work and whether this coordination is planned or reactive.
The Cost of Fragmentation#
Role specialization creates both cost efficiencies and coordination overhead. Specialized teams typically deliver higher quality work in their areas of expertise and can handle more complex requirements than generalists. However, coordination between teams requires investment in communication, tooling, and process design that doesn’t exist in single-team organizations.
The most effective cost management approach is designing interfaces that minimize coordination overhead while preserving specialization benefits. Invest in self-service tooling that allows teams to work independently within their domains. Establish clear standards and contracts that reduce the need for custom coordination on routine work. Automate handoffs wherever possible to reduce manual coordination costs.
%%{init: {'theme':'base', 'themeVariables': {'fontSize': '18px', 'fontFamily': 'arial', 'primaryColor': '#e3f2fd', 'primaryTextColor': '#000', 'primaryBorderColor': '#1976d2', 'lineColor': '#1976d2'}, 'flowchart': {'nodeSpacing': 50, 'rankSpacing': 80}}}%%
flowchart TD
    A["Cost & Risk Management"] --> B["Major Risks"]
    A --> C["Mitigation Strategies"]

    B --> B1["Communication Overhead
    Growing faster than team size,
    Coordination bottlenecks,
    Delivery delays"]

    B --> B2["Skill Gaps,
    Specialized expertise needs,
    Hiring challenges,
    Development time/cost"]

    C --> C1["Clear Documentation,
    Automated Workflows,
    Process Optimization,
    Self-Service Tooling"]

    C --> C2["Early Skill Planning,
    Clear Career Paths,
    Cross-Training Programs,
    Reduce Single Points of Failure"]

    style A fill:#1976d2,stroke:#0d47a1,stroke-width:3px,color:#fff
    style B fill:#d32f2f,stroke:#b71c1c,stroke-width:2px,color:#fff
    style C fill:#388e3c,stroke:#2e7d32,stroke-width:2px,color:#fff

    style B1 fill:#ffebee,stroke:#d32f2f,stroke-width:2px
    style B2 fill:#ffebee,stroke:#d32f2f,stroke-width:2px
    style C1 fill:#e8f5e8,stroke:#388e3c,stroke-width:2px
    style C2 fill:#e8f5e8,stroke:#388e3c,stroke-width:2px
Two major risks threaten multi-role data organizations. Communication overhead can grow faster than team size, creating coordination bottlenecks that slow delivery and increase costs. This happens when interfaces are poorly defined or when teams lack shared standards and tooling. Mitigate this risk by investing in clear documentation, automated workflows, and regular process optimization.
Skill gaps represent the second major risk. Specialized roles require specific expertise that may be difficult to hire or develop internally. Organizations often underestimate the time and cost required to build effective teams in each role. Combat this by planning skill development early, creating clear career paths within each role, and maintaining some cross-training to reduce single points of failure.
The most expensive mistake is creating role boundaries without investing in the interfaces and tooling that make them work effectively. Specialization without coordination infrastructure creates silos that reduce rather than improve organizational effectiveness.
Engineering Independence#
If you find the same technical decisions being made differently across roles, establish shared architectural principles and review processes. Consistency in technology choices, data formats, and operational practices reduces coordination overhead and enables better tool reuse. Track how often teams need to learn new tools or patterns when working with other roles.
If incident response consistently requires multiple roles to diagnose and fix problems, improve observability and ownership clarity rather than adding more communication channels. The best systems provide enough visibility for each role to understand their dependencies and enough isolation to contain failures within role boundaries.
A senior engineering manager once described inheriting a data organization where every project required a “data council” meeting with representatives from all roles to make basic technical decisions. The team spent more time in meetings than building systems. They invested six months in defining clear role boundaries, interface contracts, and decision-making authority. The result was a dramatic reduction in coordination overhead and faster delivery of new capabilities, because teams could make decisions within their domains without constant consultation.
Common Coordination Failures#
Symptom: Teams frequently blame other roles when systems fail, leading to long incident resolution times and finger-pointing. Root cause: Unclear ownership boundaries and insufficient observability into interface health. Fix: Define explicit ownership for each system component and implement monitoring that shows interface health between roles. Create incident response procedures that focus on restoration first and blame assignment never.
Symptom: Simple requests require coordination across multiple teams, creating long delivery times and high overhead for routine work. Root cause: Interfaces designed around organizational structure rather than work flow patterns. Fix: Redesign interfaces to enable self-service for common use cases. Build tooling that allows teams to complete routine work within their role boundaries without requiring coordination.
Symptom: Teams duplicate similar work across roles, creating inconsistent implementations and maintenance overhead. Root cause: Lack of shared standards and insufficient communication about existing capabilities. Fix: Establish shared architectural principles and regular cross-team communication about reusable components. Create internal documentation that helps teams discover existing solutions before building new ones.
Symptom: New team members take months to become productive because they need to understand multiple roles and complex coordination processes. Root cause: Poor documentation of role boundaries and interface contracts. Fix: Create clear onboarding materials that explain each role’s responsibilities and how they interact. Document interface contracts and escalation procedures so new team members can work effectively without extensive tribal knowledge.
Conclusion: The Coordinated System#
Effective data organizations succeed through coordinated specialization rather than individual heroics. Like the manufacturing assembly line analogy, each role contributes specialized expertise while maintaining clear interfaces with adjacent functions. Data engineers ensure reliable infrastructure, analytics engineers apply business logic, ML engineers optimize model performance, and platform engineers enable productivity across all roles.
The key insight is that interfaces matter more than individual capabilities. The best data engineers can’t compensate for unclear metric definitions. Brilliant ML engineers can’t overcome unreliable data pipelines. Excellent analytics engineers can’t fix poor deployment infrastructure. Success comes from each role doing its job well and handing off clean work through well-defined interfaces.
Today, you can start by documenting one critical handoff point in your data organization. Map the current process, identify the quality standards and delivery expectations, and clarify who owns what when problems occur. This exercise will reveal whether your role boundaries support or hinder effective collaboration—and where to focus improvement efforts next.
Understanding role boundaries and interfaces provides the foundation for building scalable data organizations. Future articles will explore the technical patterns and architectural decisions that enable these roles to work together effectively in modern data platforms.
What data engineering challenges are you facing? Connect with me on LinkedIn to share your thoughts.