
Why Teams Get Lost in Technical Details#
Your data warehouse is running, pipelines show green, but the executive dashboard displays yesterday’s numbers during the board meeting. The infrastructure costs have doubled in three months, yet nobody can explain why. Data quality issues surface in production ML models, and the compliance team questions whether they can trust the lineage documentation for the upcoming audit.
This scenario repeats across organizations because teams optimize for the wrong signals. They measure pipeline success rates instead of business value delivery. They track compute costs while ignoring the hidden expenses of data debt. They focus on technical uptime while trust erodes through inconsistent definitions and missing context.
The solution lies in establishing north-star metrics that align technical decisions with business outcomes. Four metrics matter above all others: freshness, reliability, cost, and trust. These metrics create a decision framework that transforms reactive firefighting into proactive architecture choices.
From Reactive Firefighting to Strategic Navigation#
Organizations that measure the right things make better architectural trade-offs. When freshness metrics guide design decisions, teams build systems that deliver insights when stakeholders need them, not when the technology allows it. When reliability becomes a first-class concern, data becomes a strategic asset rather than a liability that requires constant explanation and qualification.
The payoff extends beyond operational excellence. Teams with clear north-star metrics spend less time in meetings debating priorities and more time delivering value. They make confident build-versus-buy decisions because they understand which metrics each option optimizes for. Most importantly, they earn stakeholder trust by consistently delivering on the promises their metrics represent, creating a virtuous cycle where data investments receive continued support and resources.
The 4 Cardinal Metrics: Freshness, Reliability, Cost, Trust#
North-star metrics for data architecture are the four fundamental measures that should influence every significant technical decision: freshness measures how quickly data becomes available for use, reliability captures the consistency and accuracy of data delivery, cost encompasses the total economic impact of data systems, and trust reflects the confidence stakeholders have in data quality and governance.
These metrics differ from operational metrics like CPU utilization or storage capacity. They connect technical performance to business value, providing a translation layer between infrastructure concerns and stakeholder needs. They also differ from business metrics like revenue or customer satisfaction, though they should correlate with and support those outcomes.
Not this: North-star metrics are not comprehensive monitoring dashboards, detailed SLA specifications, or replacement for domain-specific quality measures. They provide strategic direction, not tactical implementation details.
The Architecture Compass Mental Model#
Think of north-star metrics as the compass for your data architecture decisions. Just as a compass provides consistent direction regardless of terrain, these four metrics provide consistent guidance regardless of technology choices, organizational structure, or business domain.
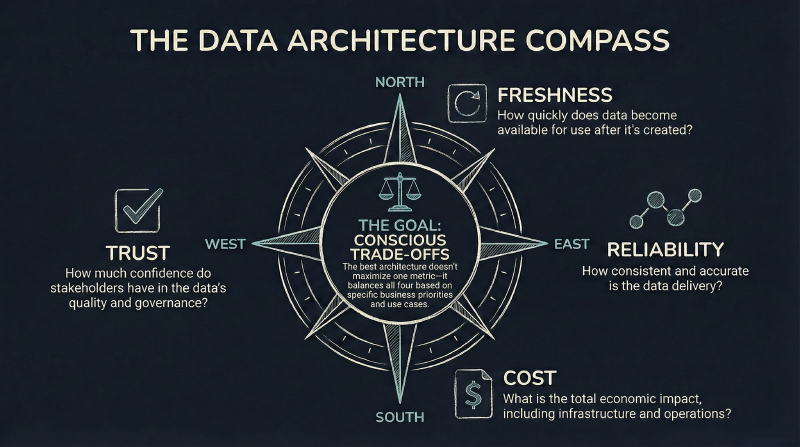
The compass analogy works because each metric represents a cardinal direction that can conflict with others. Moving toward maximum freshness might lead away from cost optimization. Pursuing perfect reliability might compromise speed to market. The art lies in understanding these trade-offs and making conscious choices about which direction to prioritize for each use case, while never losing sight of the other three directions entirely.
Decision Framework: Navigating the Trade-offs#
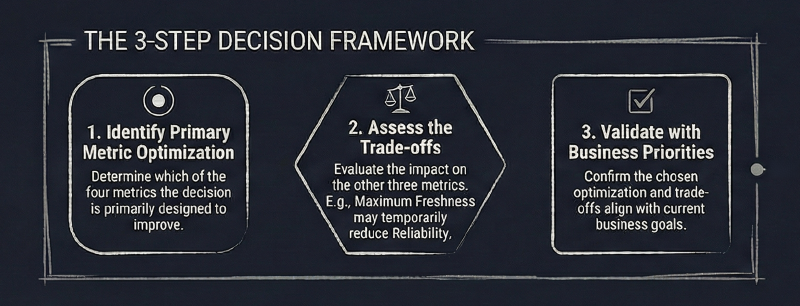
Use this framework to evaluate any significant data architecture decision. First, identify which of the four metrics the decision primarily optimizes for. Second, assess the trade-offs against the other three metrics. Third, validate that the optimization aligns with current business priorities and stakeholder expectations.
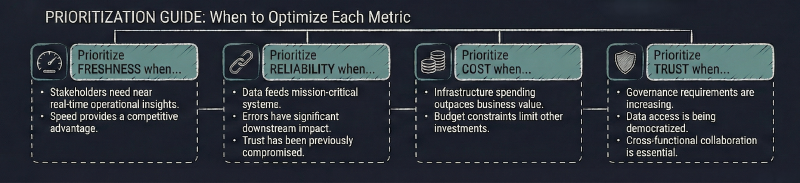
For freshness-critical decisions, prioritize when stakeholders require near real-time insights for operational decisions, when competitive advantage depends on speed to insight, or when regulatory requirements mandate timely reporting. Avoid optimizing for freshness when batch processing meets business needs, when the cost of real-time infrastructure exceeds the value of faster insights, or when data quality would suffer from reduced processing time.
For reliability-focused decisions, prioritize when data feeds mission-critical systems, when errors have significant downstream impact, or when stakeholder trust has been compromised by previous incidents. Defer reliability investments when systems serve exploratory or experimental use cases, when perfect accuracy provides marginal value over good enough, or when reliability improvements require disproportionate resource allocation.
Cost optimization becomes the priority when infrastructure expenses grow faster than business value, when budget constraints limit other investments, or when unit economics don’t support current spending patterns. Trust-building efforts take precedence when governance requirements increase, when data democratization initiatives expand access, or when cross-functional collaboration depends on shared confidence in data quality.
Case Study: Rebalancing the Compass#
Hypothetical example: A financial services company discovered their fraud detection system optimized for cost over freshness, processing transactions in four-hour batches to minimize compute expenses. When fraudulent activity spiked during a holiday weekend, the delayed detection resulted in losses that exceeded six months of infrastructure savings. The incident prompted an architecture review that rebalanced the metrics, implementing streaming processing for high-risk transactions while maintaining batch processing for routine monitoring.
This pattern repeats across industries where teams optimize for the wrong metric without understanding the business context. The lesson: north-star metrics must align with business risk tolerance and value creation patterns. Technical efficiency means nothing if it undermines business objectives.
Another common pattern emerges when organizations pursue reliability without considering trust. Teams build robust pipelines with impressive uptime statistics, but stakeholders lose confidence because they can’t understand data lineage or validate business logic. The technical system succeeds while the business system fails, highlighting the interconnected nature of these metrics.
Blueprint: Calibrating Your Compass#
Start by establishing baseline measurements for each metric across your most critical data products. Define freshness as the time from data creation to availability for consumption, measure reliability through data quality scores and system uptime, calculate total cost of ownership including hidden operational expenses, and assess trust through stakeholder surveys and governance compliance scores.
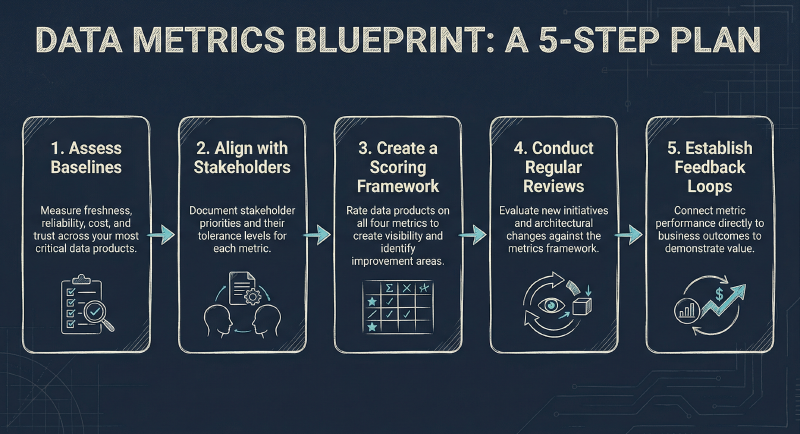
Next, identify the primary stakeholders for each data product and understand their tolerance levels for each metric. Marketing teams might prioritize freshness for campaign optimization, while finance teams might prioritize reliability for regulatory reporting. Document these preferences to guide future trade-off decisions.
Create a simple scoring framework that rates each data product on all four metrics using a consistent scale. This creates visibility into current performance and highlights improvement opportunities. Focus initial efforts on products where metric performance significantly misaligns with stakeholder priorities.
Establish regular review cycles where teams evaluate new initiatives and architectural changes against the four metrics. Include these discussions in design reviews, vendor evaluations, and incident retrospectives to embed the framework into decision-making processes.
Finally, create feedback loops that connect metric performance to business outcomes. Track how improvements in freshness correlate with faster decision-making, how reliability investments reduce operational overhead, how cost optimizations free resources for innovation, and how trust-building efforts enable broader data adoption.
Metrics: Cardinal Directions and Warning Signs#
Measure freshness through end-to-end latency from source system changes to consumer availability, typically expressed as percentiles rather than averages to capture tail behavior. Target ranges vary by use case: real-time operational systems might require sub-minute freshness, while analytical workloads might tolerate hourly or daily updates. Leading indicators include source system lag, processing queue depth, and downstream consumer polling frequency.
Reliability metrics combine system availability with data quality measures. Track pipeline success rates, data completeness percentages, and schema compliance scores alongside traditional uptime metrics. Typical targets range from three to five nines depending on criticality, but focus on business impact rather than pure technical availability. Monitor error rates, retry patterns, and manual intervention frequency as early warning signals.
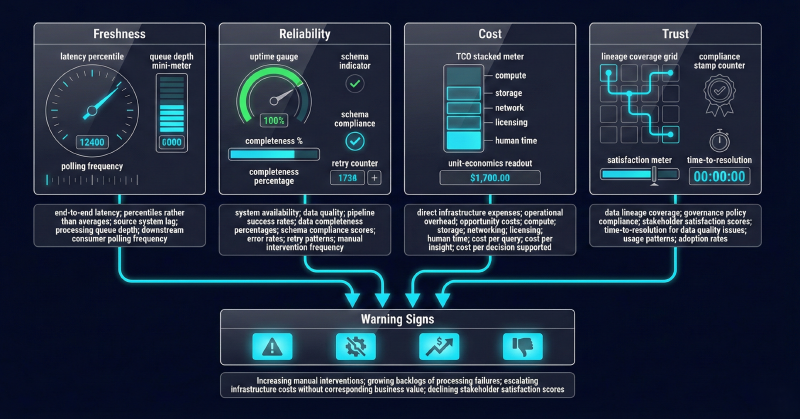
Cost measurement requires comprehensive tracking of direct infrastructure expenses, operational overhead, and opportunity costs. Include compute, storage, networking, licensing, and human time in total cost calculations. Establish unit economics that connect spending to business value, such as cost per query, cost per insight, or cost per decision supported.
Trust metrics prove more challenging to quantify but remain essential. Track data lineage coverage, governance policy compliance, stakeholder satisfaction scores, and time-to-resolution for data quality issues. Monitor usage patterns and adoption rates as proxy measures for stakeholder confidence.
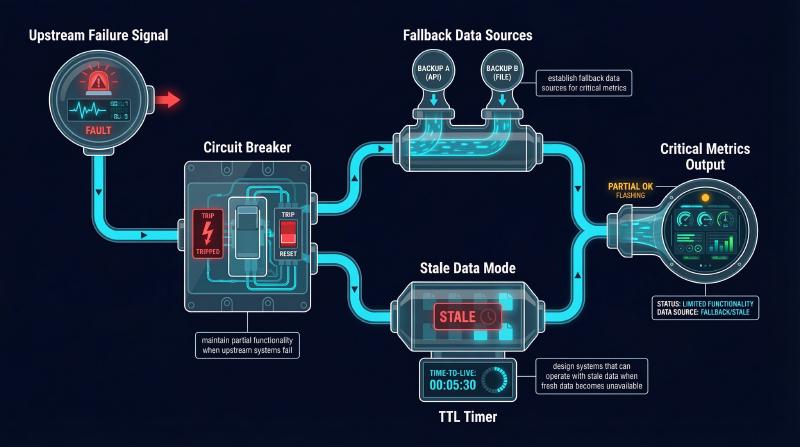
Build anti-fragility through graceful degradation patterns. Implement circuit breakers that maintain partial functionality when upstream systems fail, establish fallback data sources for critical metrics, and design systems that can operate with stale data when fresh data becomes unavailable.
The Economics of Directional Choices#
The primary cost drivers span infrastructure, operations, and opportunity costs. Infrastructure expenses include compute for processing, storage for retention, and networking for data movement. Operational costs encompass monitoring, maintenance, incident response, and compliance activities. Opportunity costs arise when poor metric performance prevents teams from pursuing higher-value initiatives.
Control costs through three key levers: right-sizing infrastructure to match actual usage patterns rather than peak theoretical demand, implementing intelligent caching and materialization strategies that balance freshness with compute efficiency, and establishing clear data retention policies that automatically archive or delete data based on business value rather than technical convenience.
The biggest risk lies in optimizing for the wrong metric at the wrong time. Teams often pursue technical elegance over business value, building systems that excel in areas where excellence provides minimal benefit while underperforming in areas where stakeholders notice every shortcoming. This misalignment wastes resources and erodes confidence in data investments.
Another significant risk emerges from metric gaming, where teams optimize for measurement rather than underlying value. Freshness metrics might encourage frequent but unnecessary data refreshes, reliability metrics might discourage necessary system changes, and cost metrics might drive decisions that compromise long-term maintainability for short-term savings.
Advanced Navigation: Course Correction#
If cost optimization efforts repeatedly target the same systems, examine whether those systems serve multiple use cases with conflicting requirements. Consider splitting workloads to optimize each use case independently rather than compromising all use cases with a single solution.
If reliability incidents cluster around specific data sources or processing steps, implement progressive quality gates that catch issues closer to the source. Watch for patterns where upstream data quality problems cascade through multiple downstream systems.
If trust metrics remain low despite technical improvements, focus on communication and transparency rather than additional technical controls. Stakeholders often value understanding over perfection.
Common Navigation Errors#
Symptom: Teams measure pipeline success rates but stakeholders complain about data quality. Root cause: Technical success doesn’t guarantee business value when data passes validation checks but fails business logic expectations. Fix: Implement business-rule validation alongside technical checks and include stakeholder feedback in quality assessments.
Symptom: Cost optimization efforts reduce infrastructure spending but increase operational overhead. Root cause: Focusing on direct costs while ignoring indirect costs shifts expenses rather than reducing them. Fix: Measure total cost of ownership including human time, opportunity costs, and downstream impact of cost-cutting decisions.
Symptom: Freshness improvements increase system complexity without improving decision-making speed. Root cause: Optimizing for technical latency without understanding business decision cycles creates solutions that solve the wrong problem. Fix: Map data consumption patterns to actual decision-making processes and optimize for business value rather than technical metrics.
Symptom: Reliability investments focus on preventing rare catastrophic failures while ignoring frequent minor issues. Root cause: Dramatic incidents receive attention while chronic problems become normalized background noise. Fix: Track cumulative impact of minor issues and address patterns that create ongoing friction for stakeholders.
Symptom: Trust-building efforts emphasize governance processes but stakeholders remain skeptical about data accuracy. Root cause: Process compliance doesn’t guarantee outcome quality when underlying data issues persist. Fix: Combine governance frameworks with transparent quality reporting and proactive issue communication.
Next Steps: Charting Your Course#
The compass metaphor becomes most powerful when teams internalize these four directions as natural considerations for every architectural decision. Instead of debating technical implementation details, conversations focus on business value alignment and conscious trade-off decisions. This shift transforms data engineering from a reactive support function into a strategic capability that drives business outcomes.
Teams can make one decision today: identify their most critical data product and assess its current performance against all four north-star metrics. This assessment reveals whether current architectural choices align with stakeholder priorities and highlights the most impactful improvement opportunities.
This foundation of measurement and alignment enables the next level of data architecture maturity: designing systems that adapt to changing business priorities while maintaining consistent performance across all four metrics. The following article explores how modern storage and processing patterns support this adaptability through the evolution from warehouses to lakehouses.
What data architecture metric challenges are you facing? Connect with me on LinkedIn to share your thoughts.