If you are a Data Engineering Manager or a Platform Lead, your primary challenge is not just technical; it is a matter of definition. Without a clear purpose, your team becomes a ticket-taking service, drowning in ad-hoc requests and bespoke pipelines that do not scale. To move beyond the factory floor, you must redefine the organization’s reason for being.
If your top five datasets lost their owner tomorrow, what would the cost to the business be by Friday? If you cannot answer that, you are not managing a platform; you are managing a liability.
This post is a guide for DE leaders who want to reposition their organizations. The goal is to move away from infrastructure for infrastructure’s sake and toward a service-oriented model that earns executive trust through visibility and reliability. A Data Engineering organization exists for one central purpose: to make trustworthy data accessible at the speed the business needs it. By converting raw signals into governed, reliable data products, DE enables the analytics, automation, and machine learning that drive modern business outcomes.
Key Takeaways#
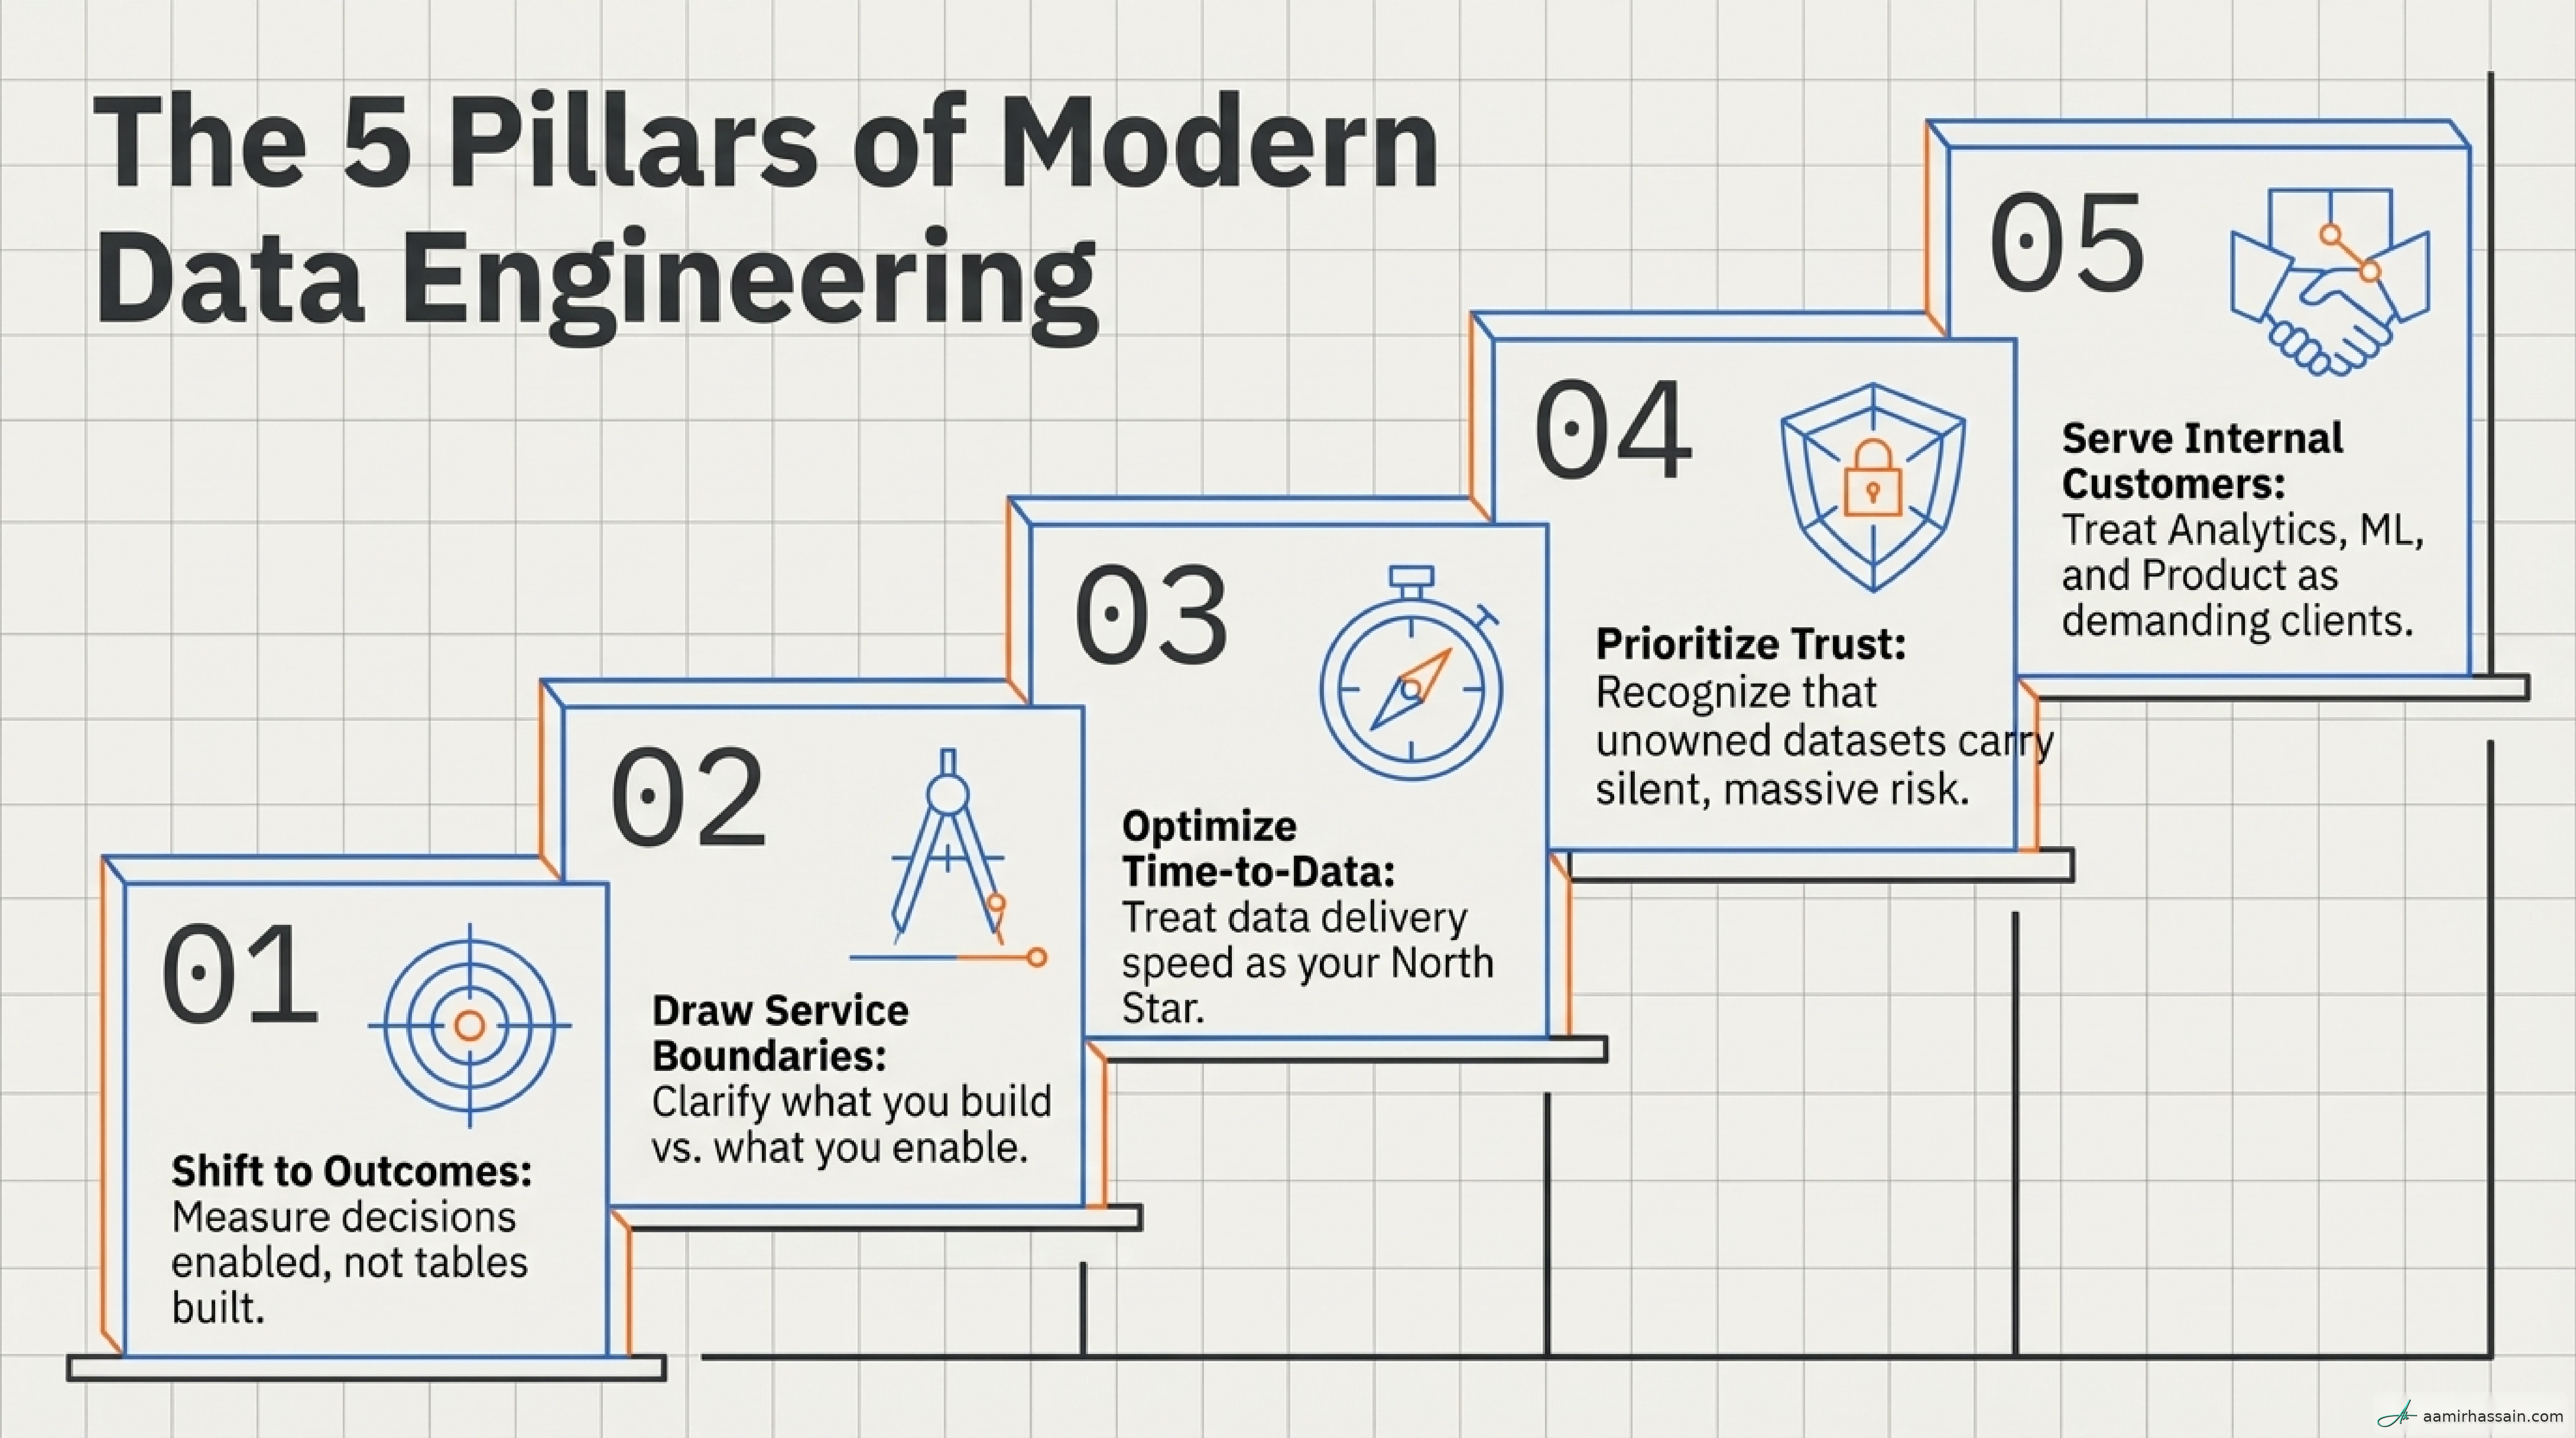
- Shift from output to outcome: Success is measured by business impact—revenue enabled, risk reduced, and decisions improved—not by the number of pipelines shipped or tables created.
- Use Time-to-Data as your north star: Measure the elapsed time from an event occurring to that data being usable by consumers.
- Define clear service boundaries: Be explicit about what the DE team owns and what it enables.
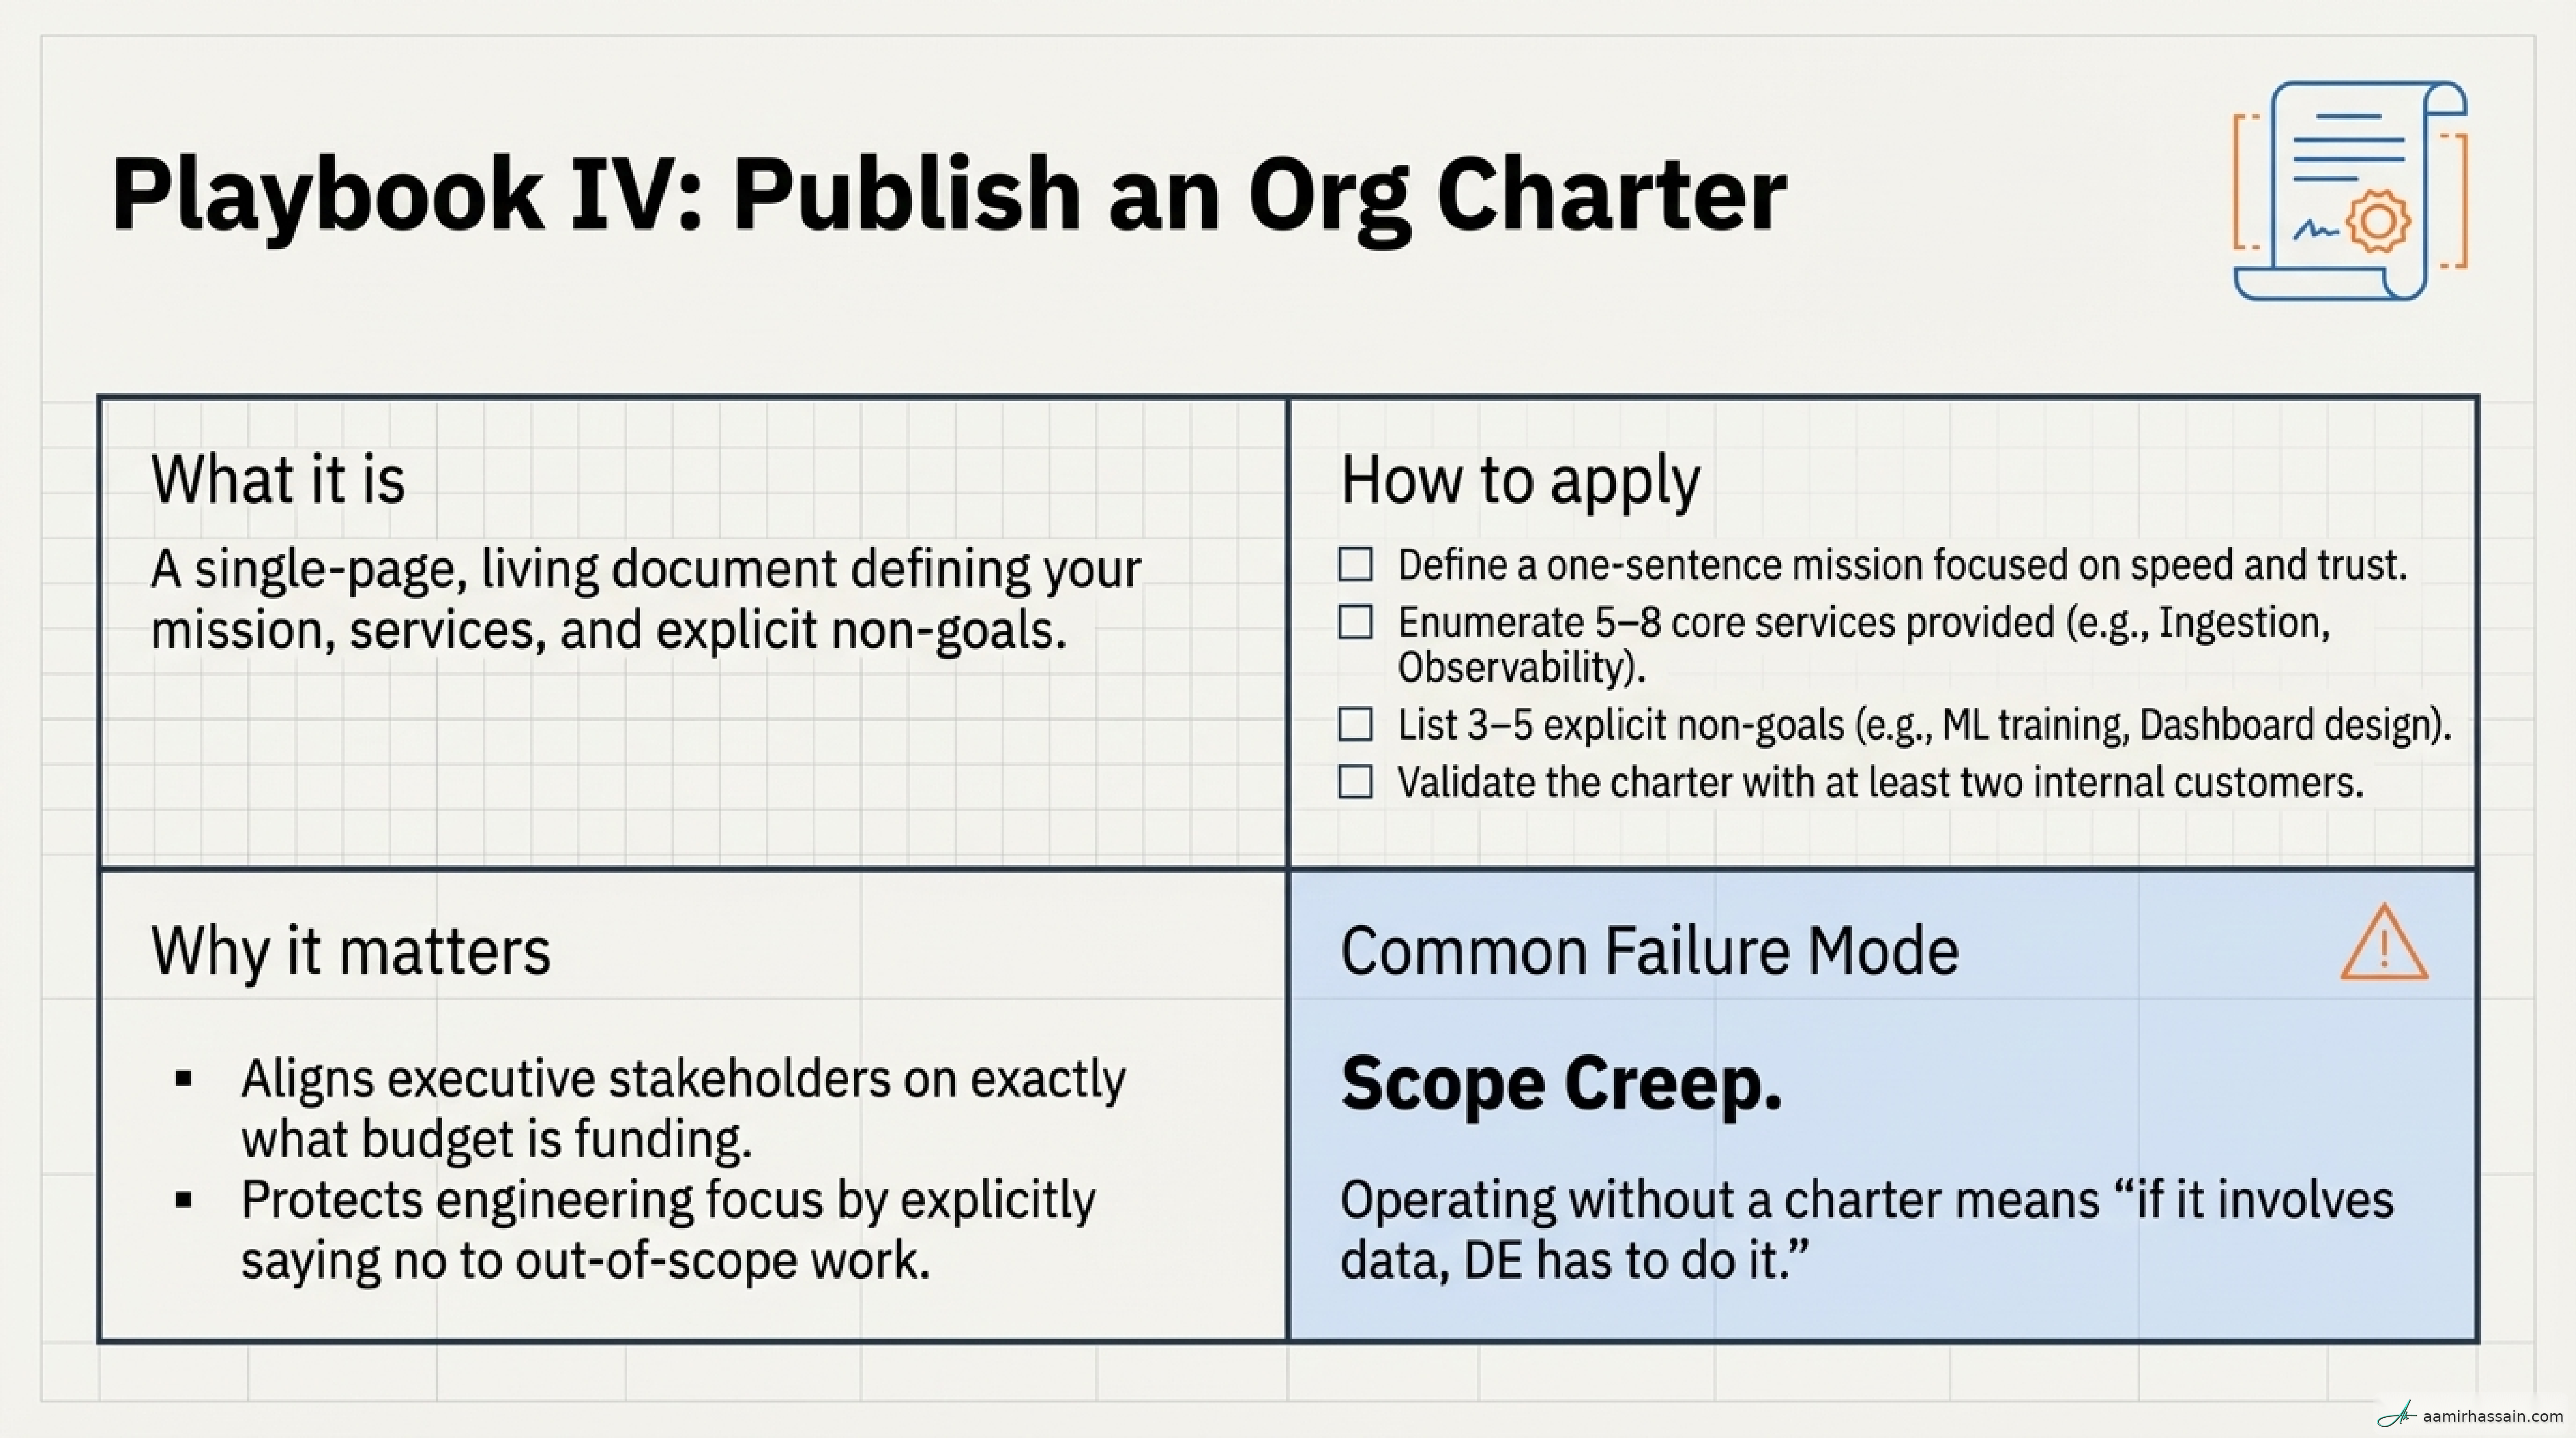
- Use a DE charter to create visibility: A formal charter prevents scope creep and clarifies the value of the function.
- Treat trust as a measurable asset: Adoption rates, incident frequency, ownership, and SLAs all matter.
- Standardize to scale: Every bespoke pipeline multiplies on-call toil. Standardized paved roads are what allow growth without linear headcount increases.
Outcomes Over Outputs#
The most important mental shift for a DE leader is moving from outputs to outcomes. In a technical vacuum, it is easy to celebrate outputs—the visible work delivered. A team might report that it created 40 new tables or migrated 100 pipelines. To an executive, those are vanity metrics unless they clearly connect to business value.
Outcomes are the business results enabled by that work. Data Engineering’s value is realized only when the business can act on the data with confidence.
graph LR
A[Source
Raw signals] --> B[Pipeline
Ingest, clean, move]
B --> C[Analytics / ML
Models and insights]
C --> D[Decision / Action
Business outcome]
When communicating with leadership, tie technical effort to the end state:
- Weak (output-focused): “We shipped 40 new pipelines this quarter.”
- Strong (outcome-focused): “We cut reporting latency by three days for the Finance team, allowing them to close the books faster and identify budget variances in real time, reducing financial risk.”
By framing work through outcomes, you show that DE is an enabler of downstream value creation. Whether that means powering a fraud model that saves millions or reducing the time it takes for an analyst to build a dashboard, the why must always come before the how.
The Practical Playbook#
To transform your organization, you need an operating model that defines your mission, identifies your customers, and standardizes delivery.
Defining the Mission and Boundaries#
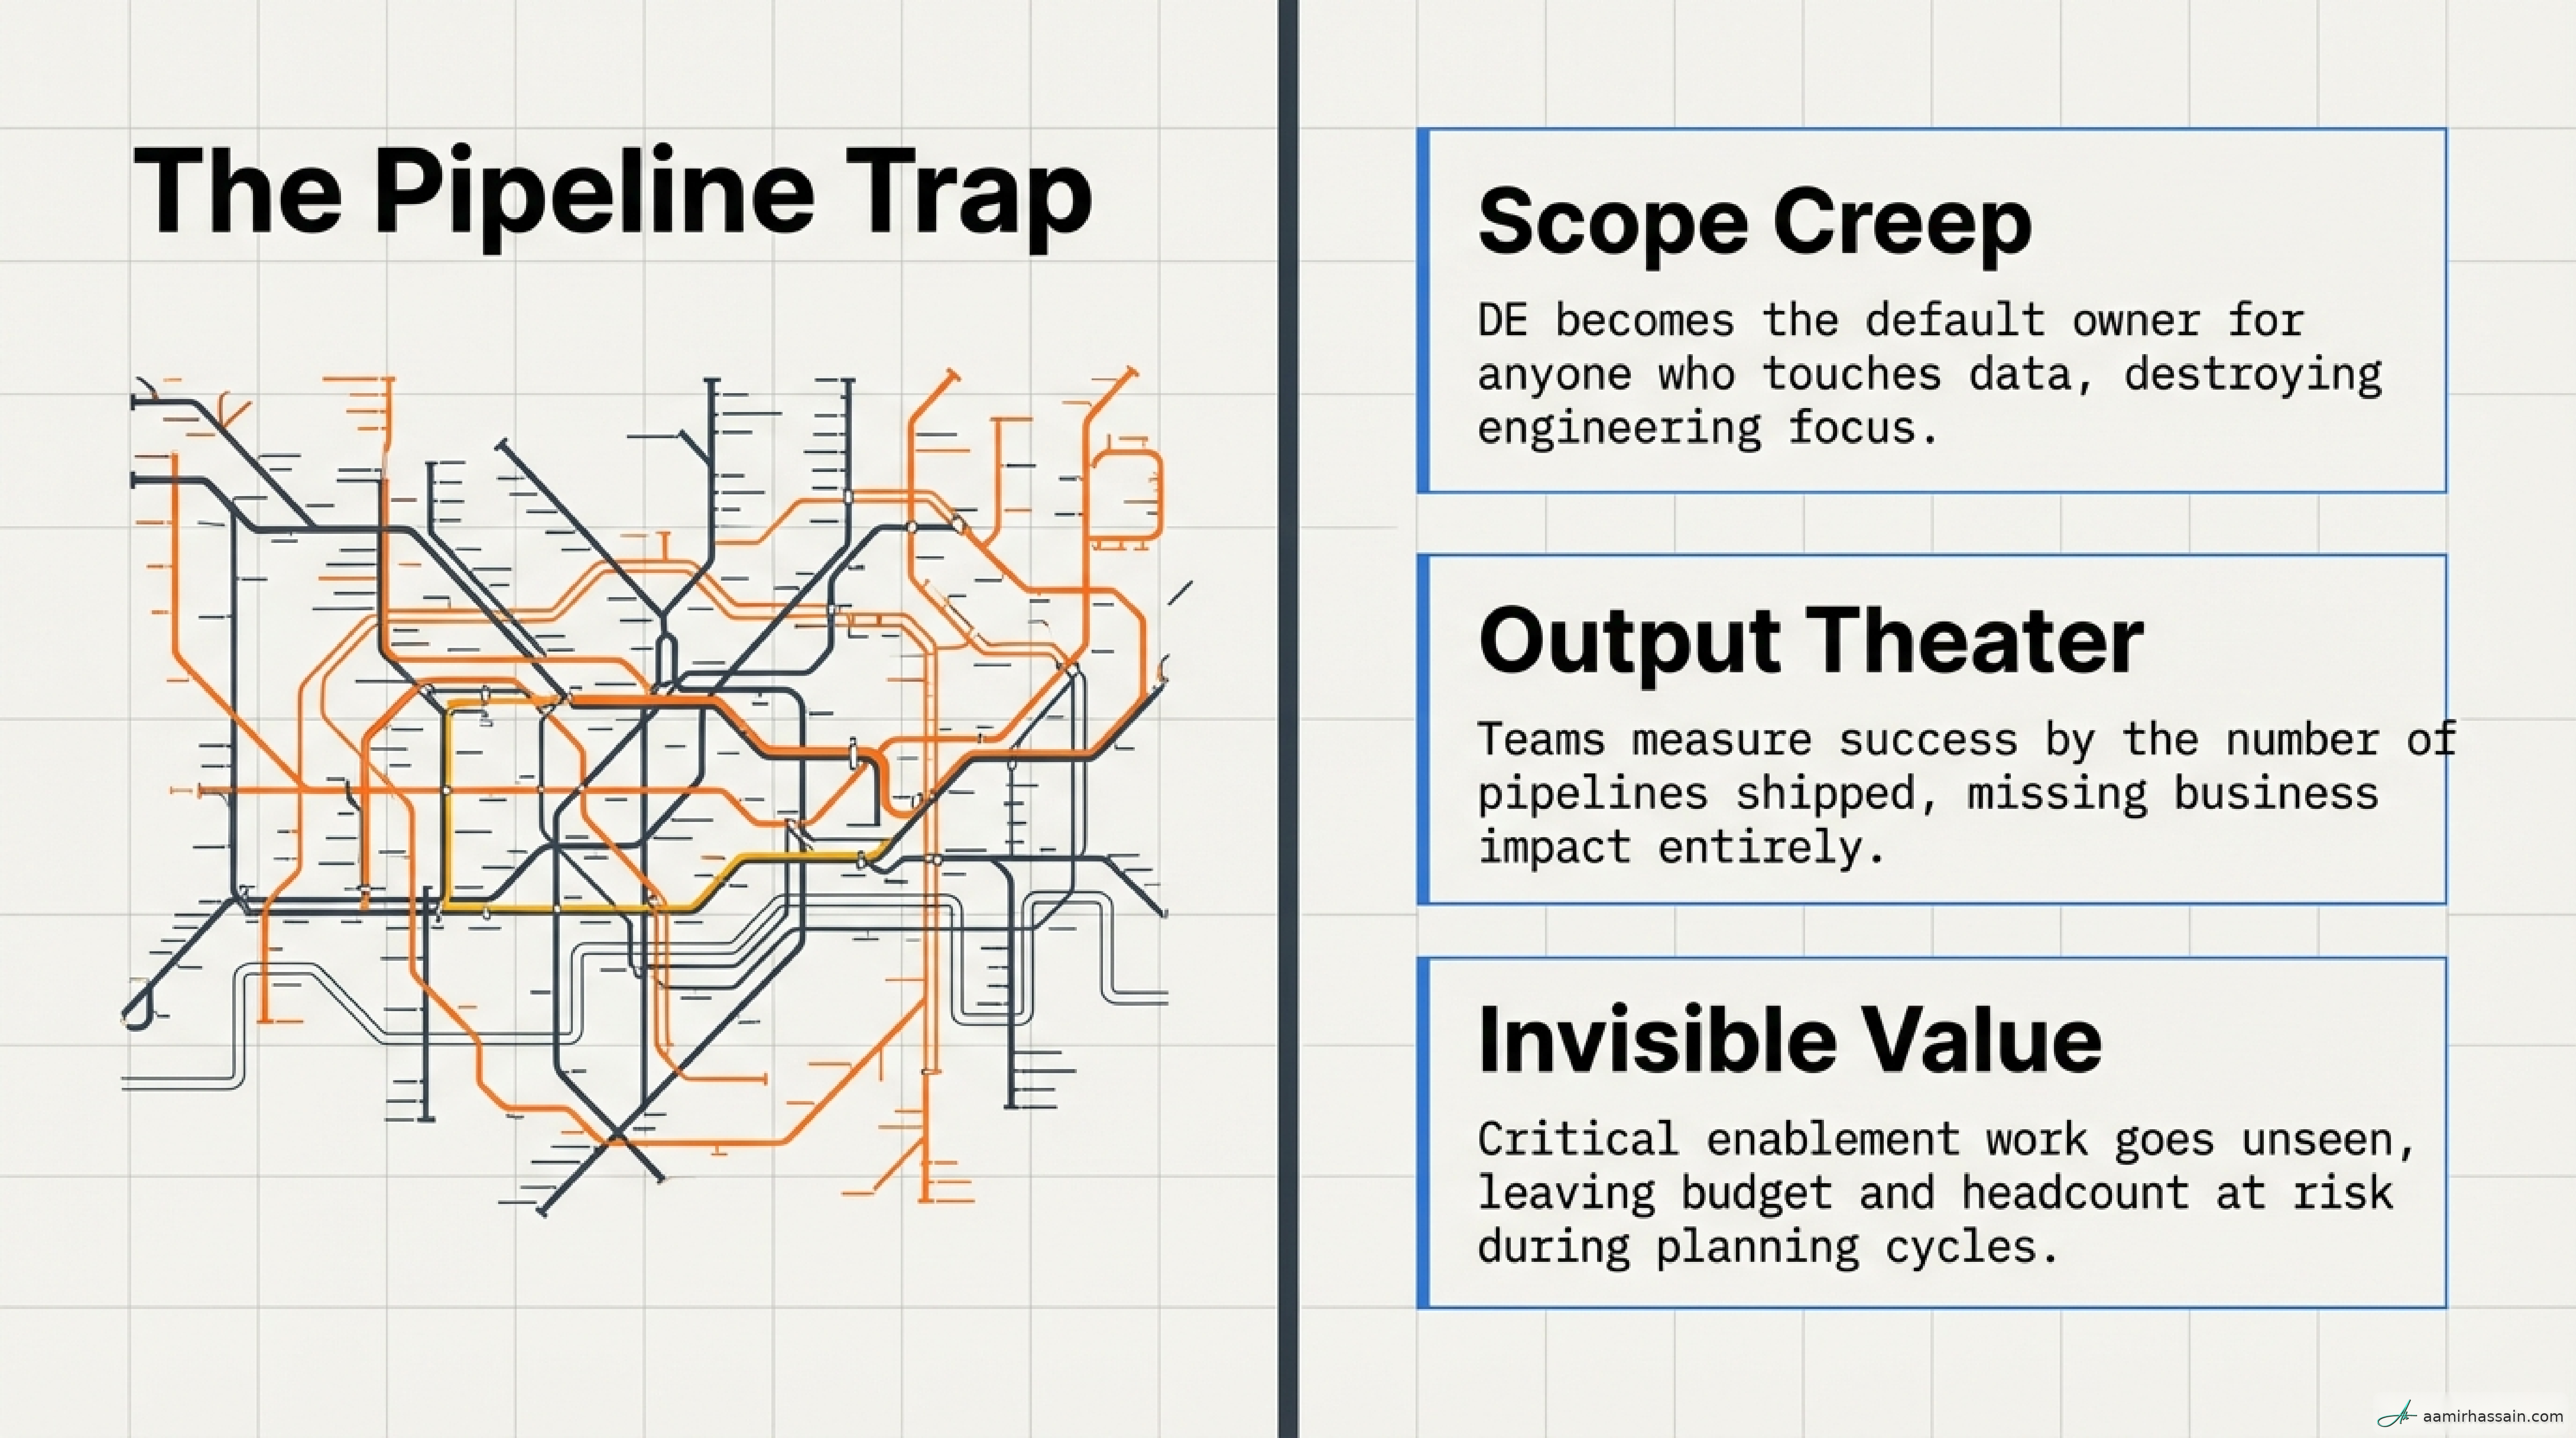
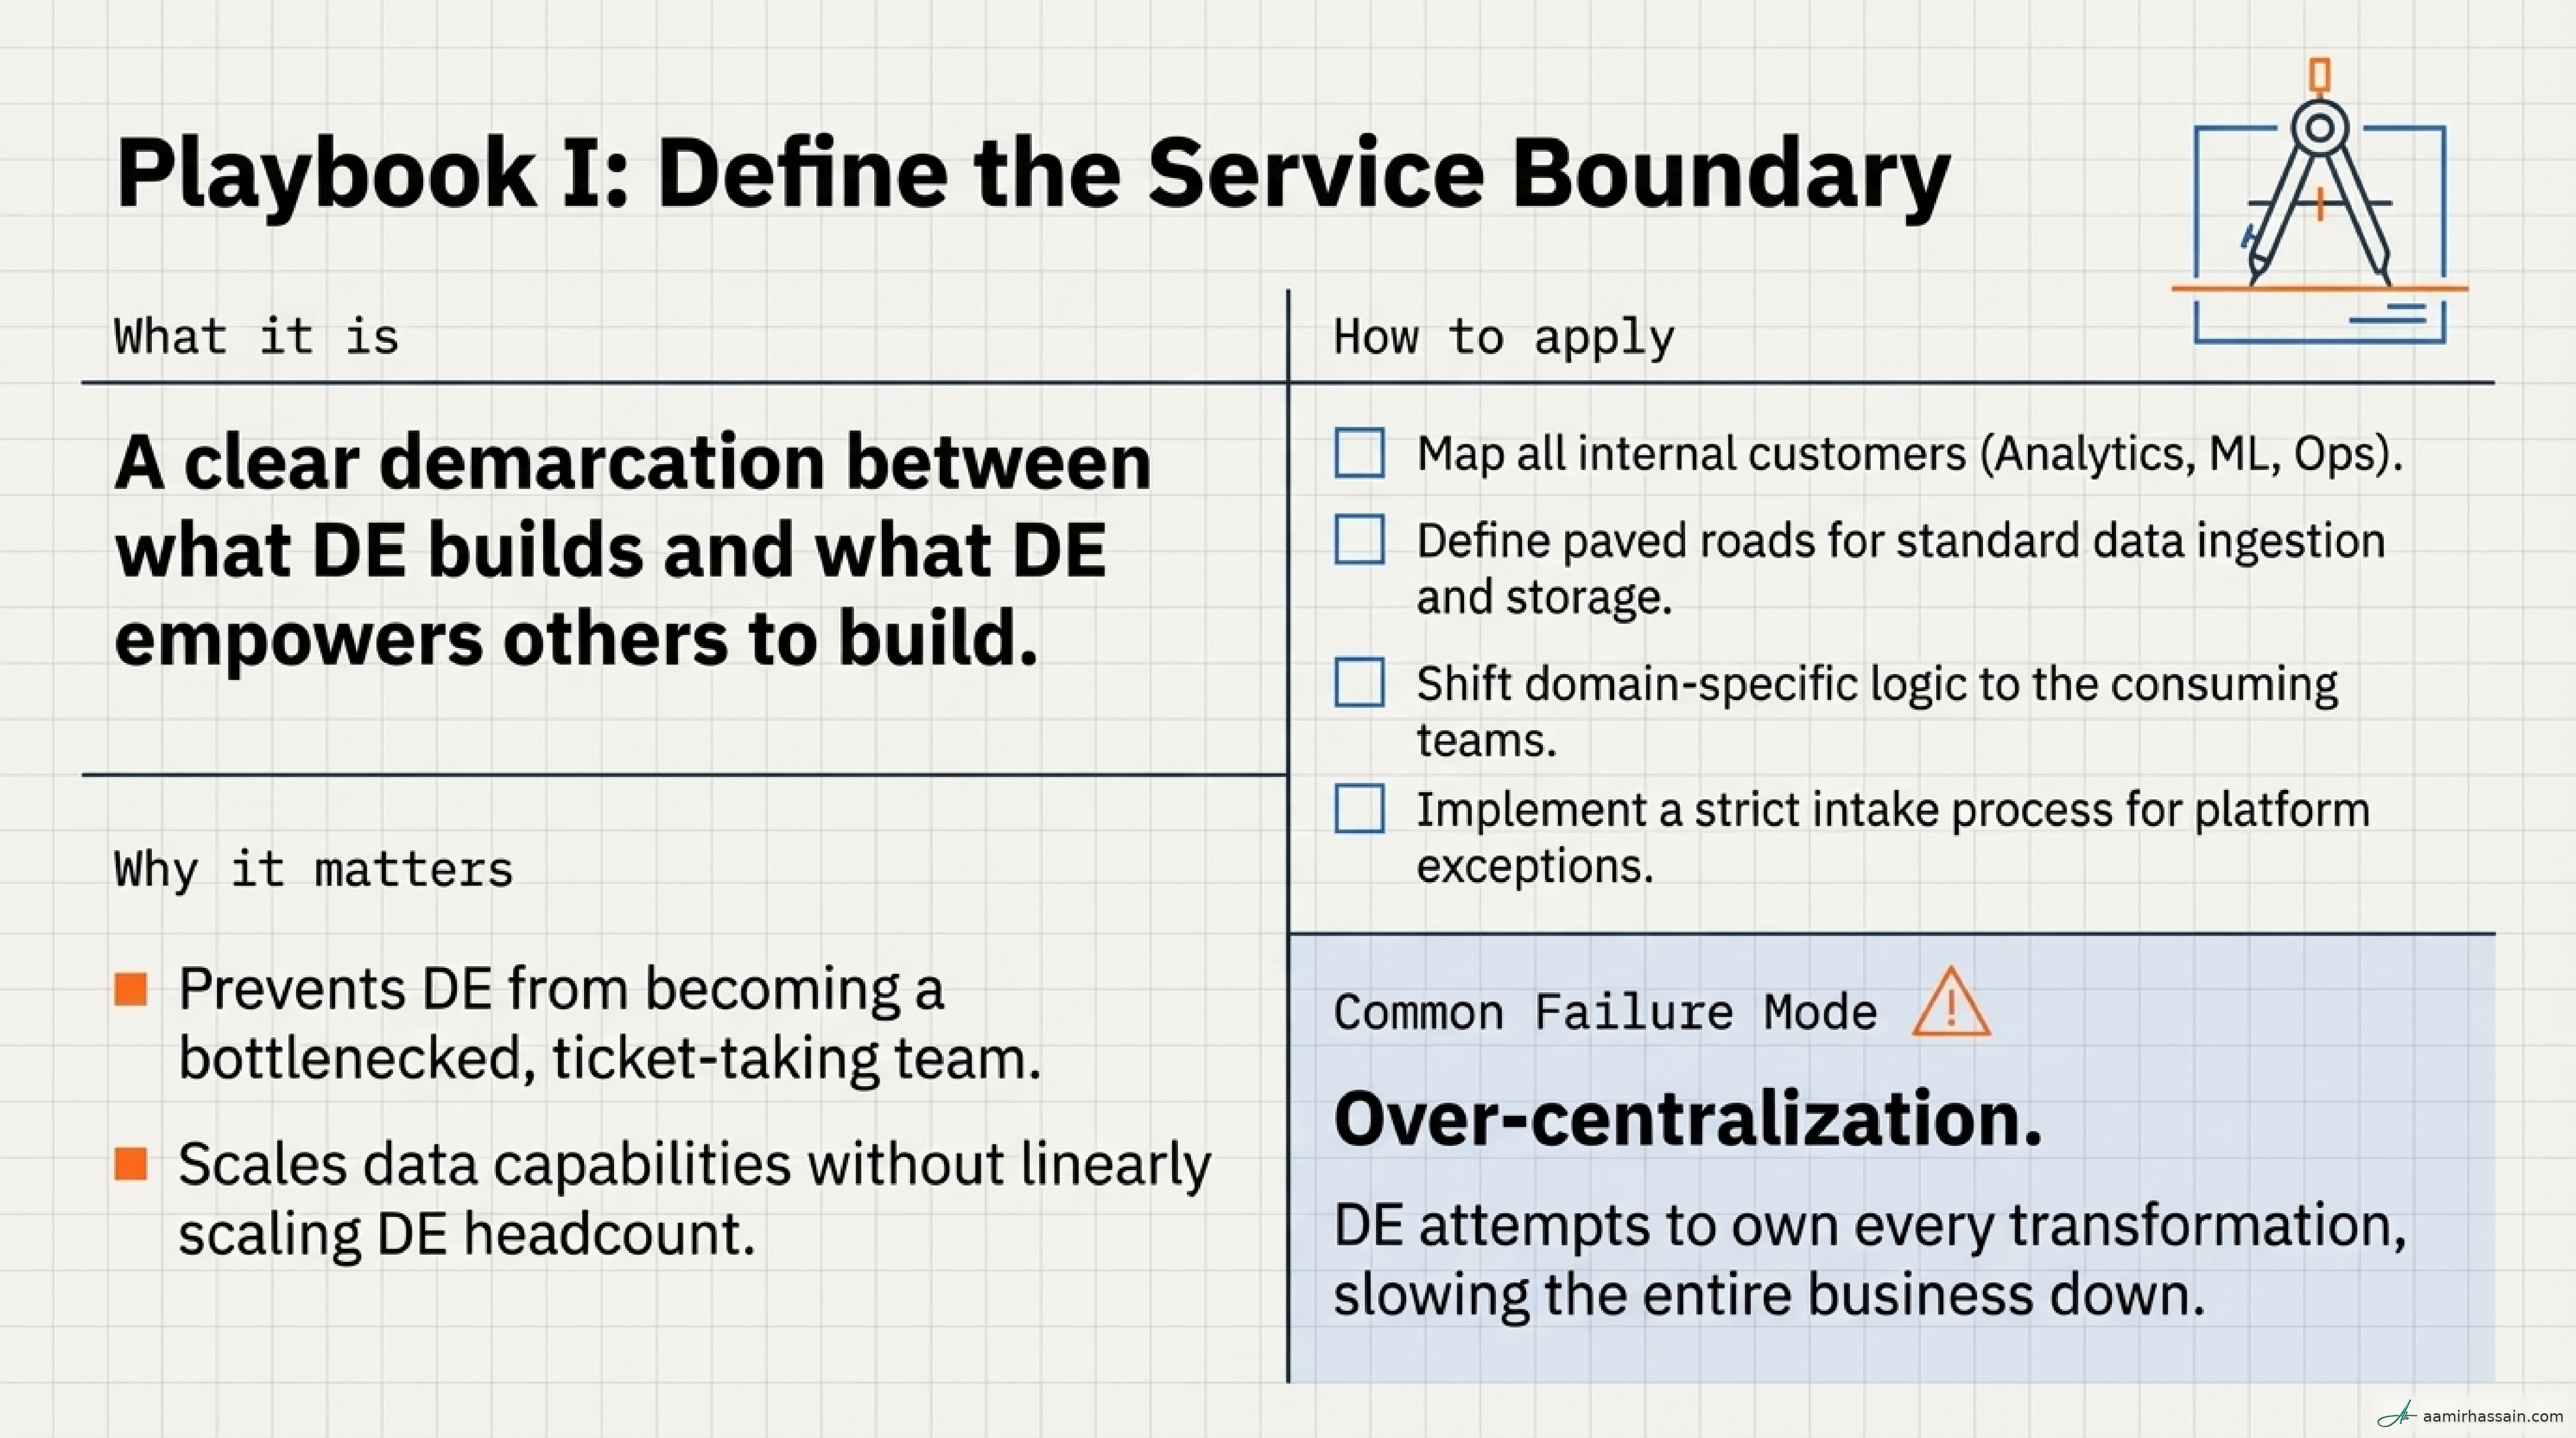
Without a clear mission and explicit boundaries, Data Engineering inevitably becomes “anyone who touches data.” That is where scope creep begins. Engineers get pulled into dashboard design, ad-hoc analysis, or model-adjacent work instead of building scalable systems.
To prevent this, distinguish clearly between Data Engineering, Data Science, and Analytics. DE builds the infrastructure. DS builds the models. Analytics interprets the data.
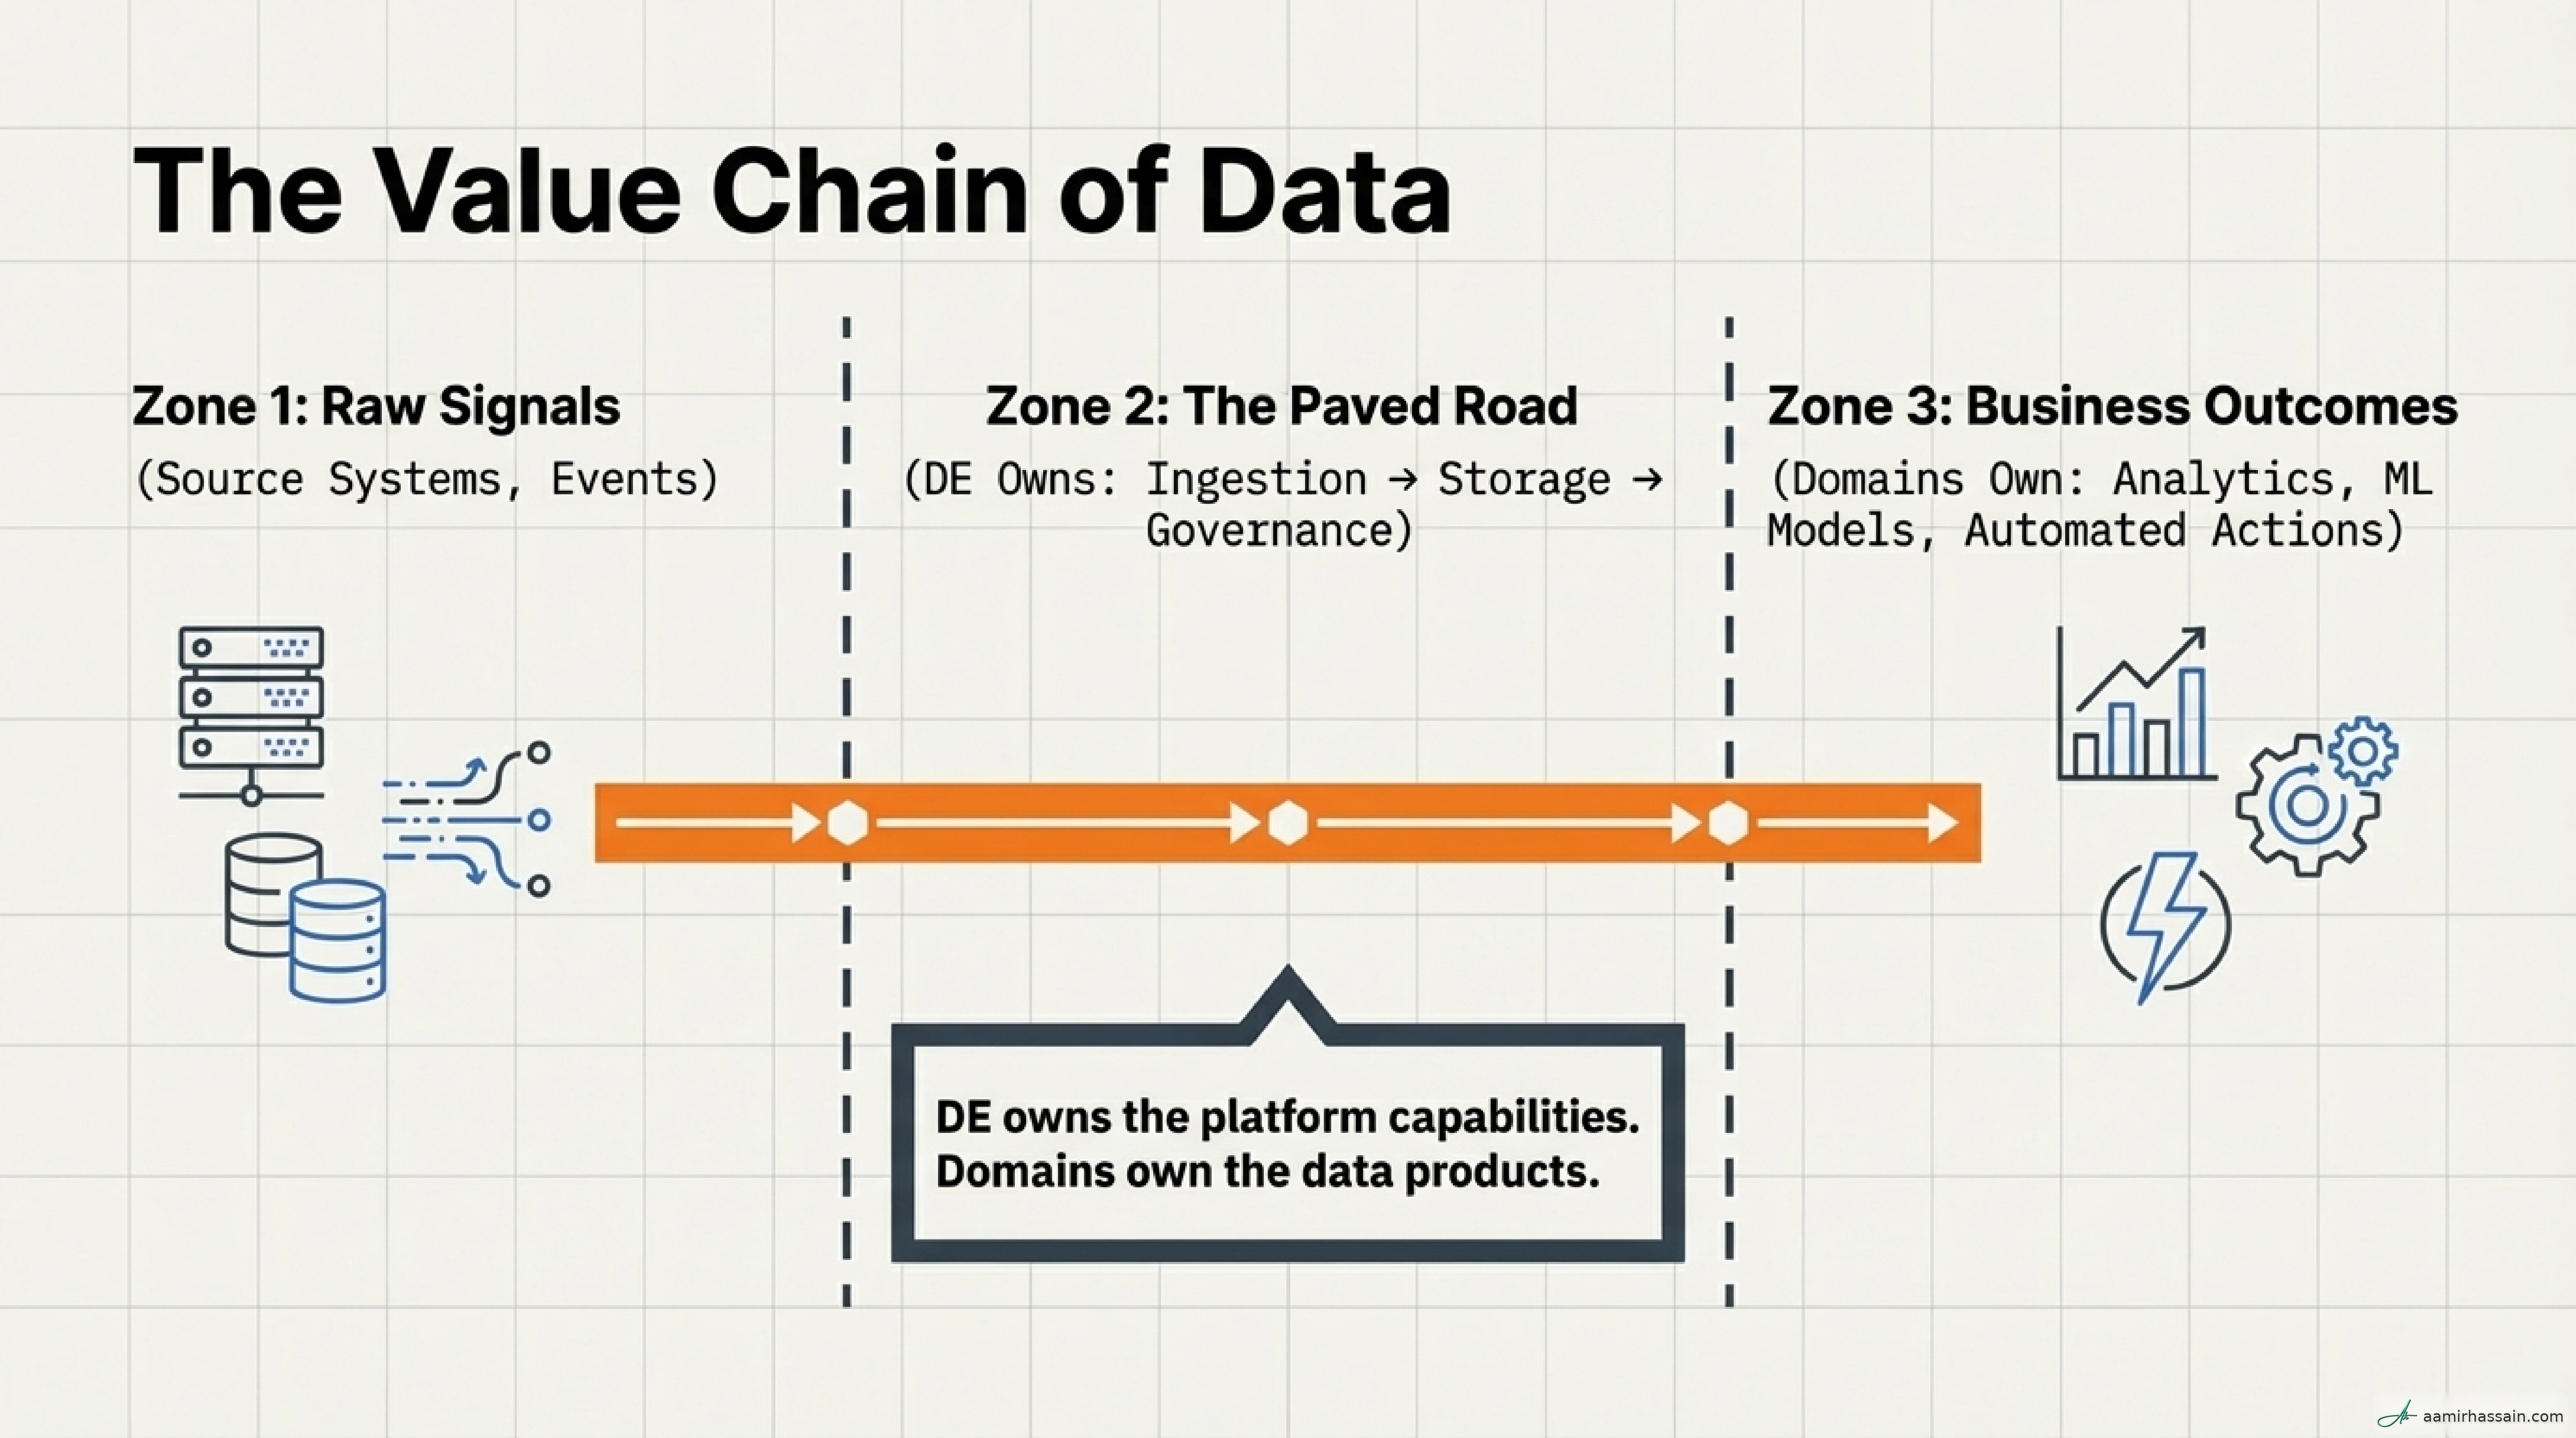
A high-performing DE organization operates on an own vs. enable model. DE owns the paved road: ingestion frameworks, orchestration engines, storage layers, governance foundations, and reliability patterns. Domain teams extend those capabilities to build their own data products. That is what prevents DE from becoming the bottleneck for every data-related task in the company.
Checklist: Drafting Your DE Charter#
- Identify internal customers such as Marketing, Finance, Analytics, and ML.
- Define a one-sentence mission statement.
- Enumerate core services such as ingestion, storage, governance, and orchestration.
- State non-goals explicitly, including work your team does not own.
- Set three to five success metrics with targets.
- Establish a clear intake process for new work.
- Define service boundaries between DE and the domains.
- Validate the charter with peer leaders and stakeholders.
What Good Looks Like#
- The team has a published one-pager that defines its scope and non-goals.
- Stakeholders understand when to submit a ticket and when to self-serve.
- Engineers can say no to out-of-scope requests by pointing to the charter.
Failure mode: Scope creep. If the DE team is treated as an extension of Analytics or SRE, technical focus is lost. Mitigation: enforce an explicit intake process and refer back to the charter’s non-goals during planning.
Mapping Internal Customers#
Treat internal teams as service customers. Different stakeholders care about different value dimensions, and DE must speak to each one.
- Analytics / BI: Values freshness and trust. They need paved roads for self-service.
- Machine Learning: Values low-latency features and scalable access to high-volume training data.
- Finance / Compliance: Values trust, auditability, privacy, and retention.
- Executive Leadership: Values cost efficiency and visible proof of impact.
Checklist: Identifying Customer Needs#
- Interview the top three consumers of your data to understand their quarterly goals.
- Identify their primary pain points.
- Map those pain points to DE capabilities.
- Align roadmap items with stakeholder success metrics.
- Publish a service catalog so customers know what they can actually request.
What Good Looks Like#
- DE initiatives are directly linked to stakeholder success metrics.
- Success is measured through consumer adoption and satisfaction.
- Customers know what the platform offers and how to engage with it.
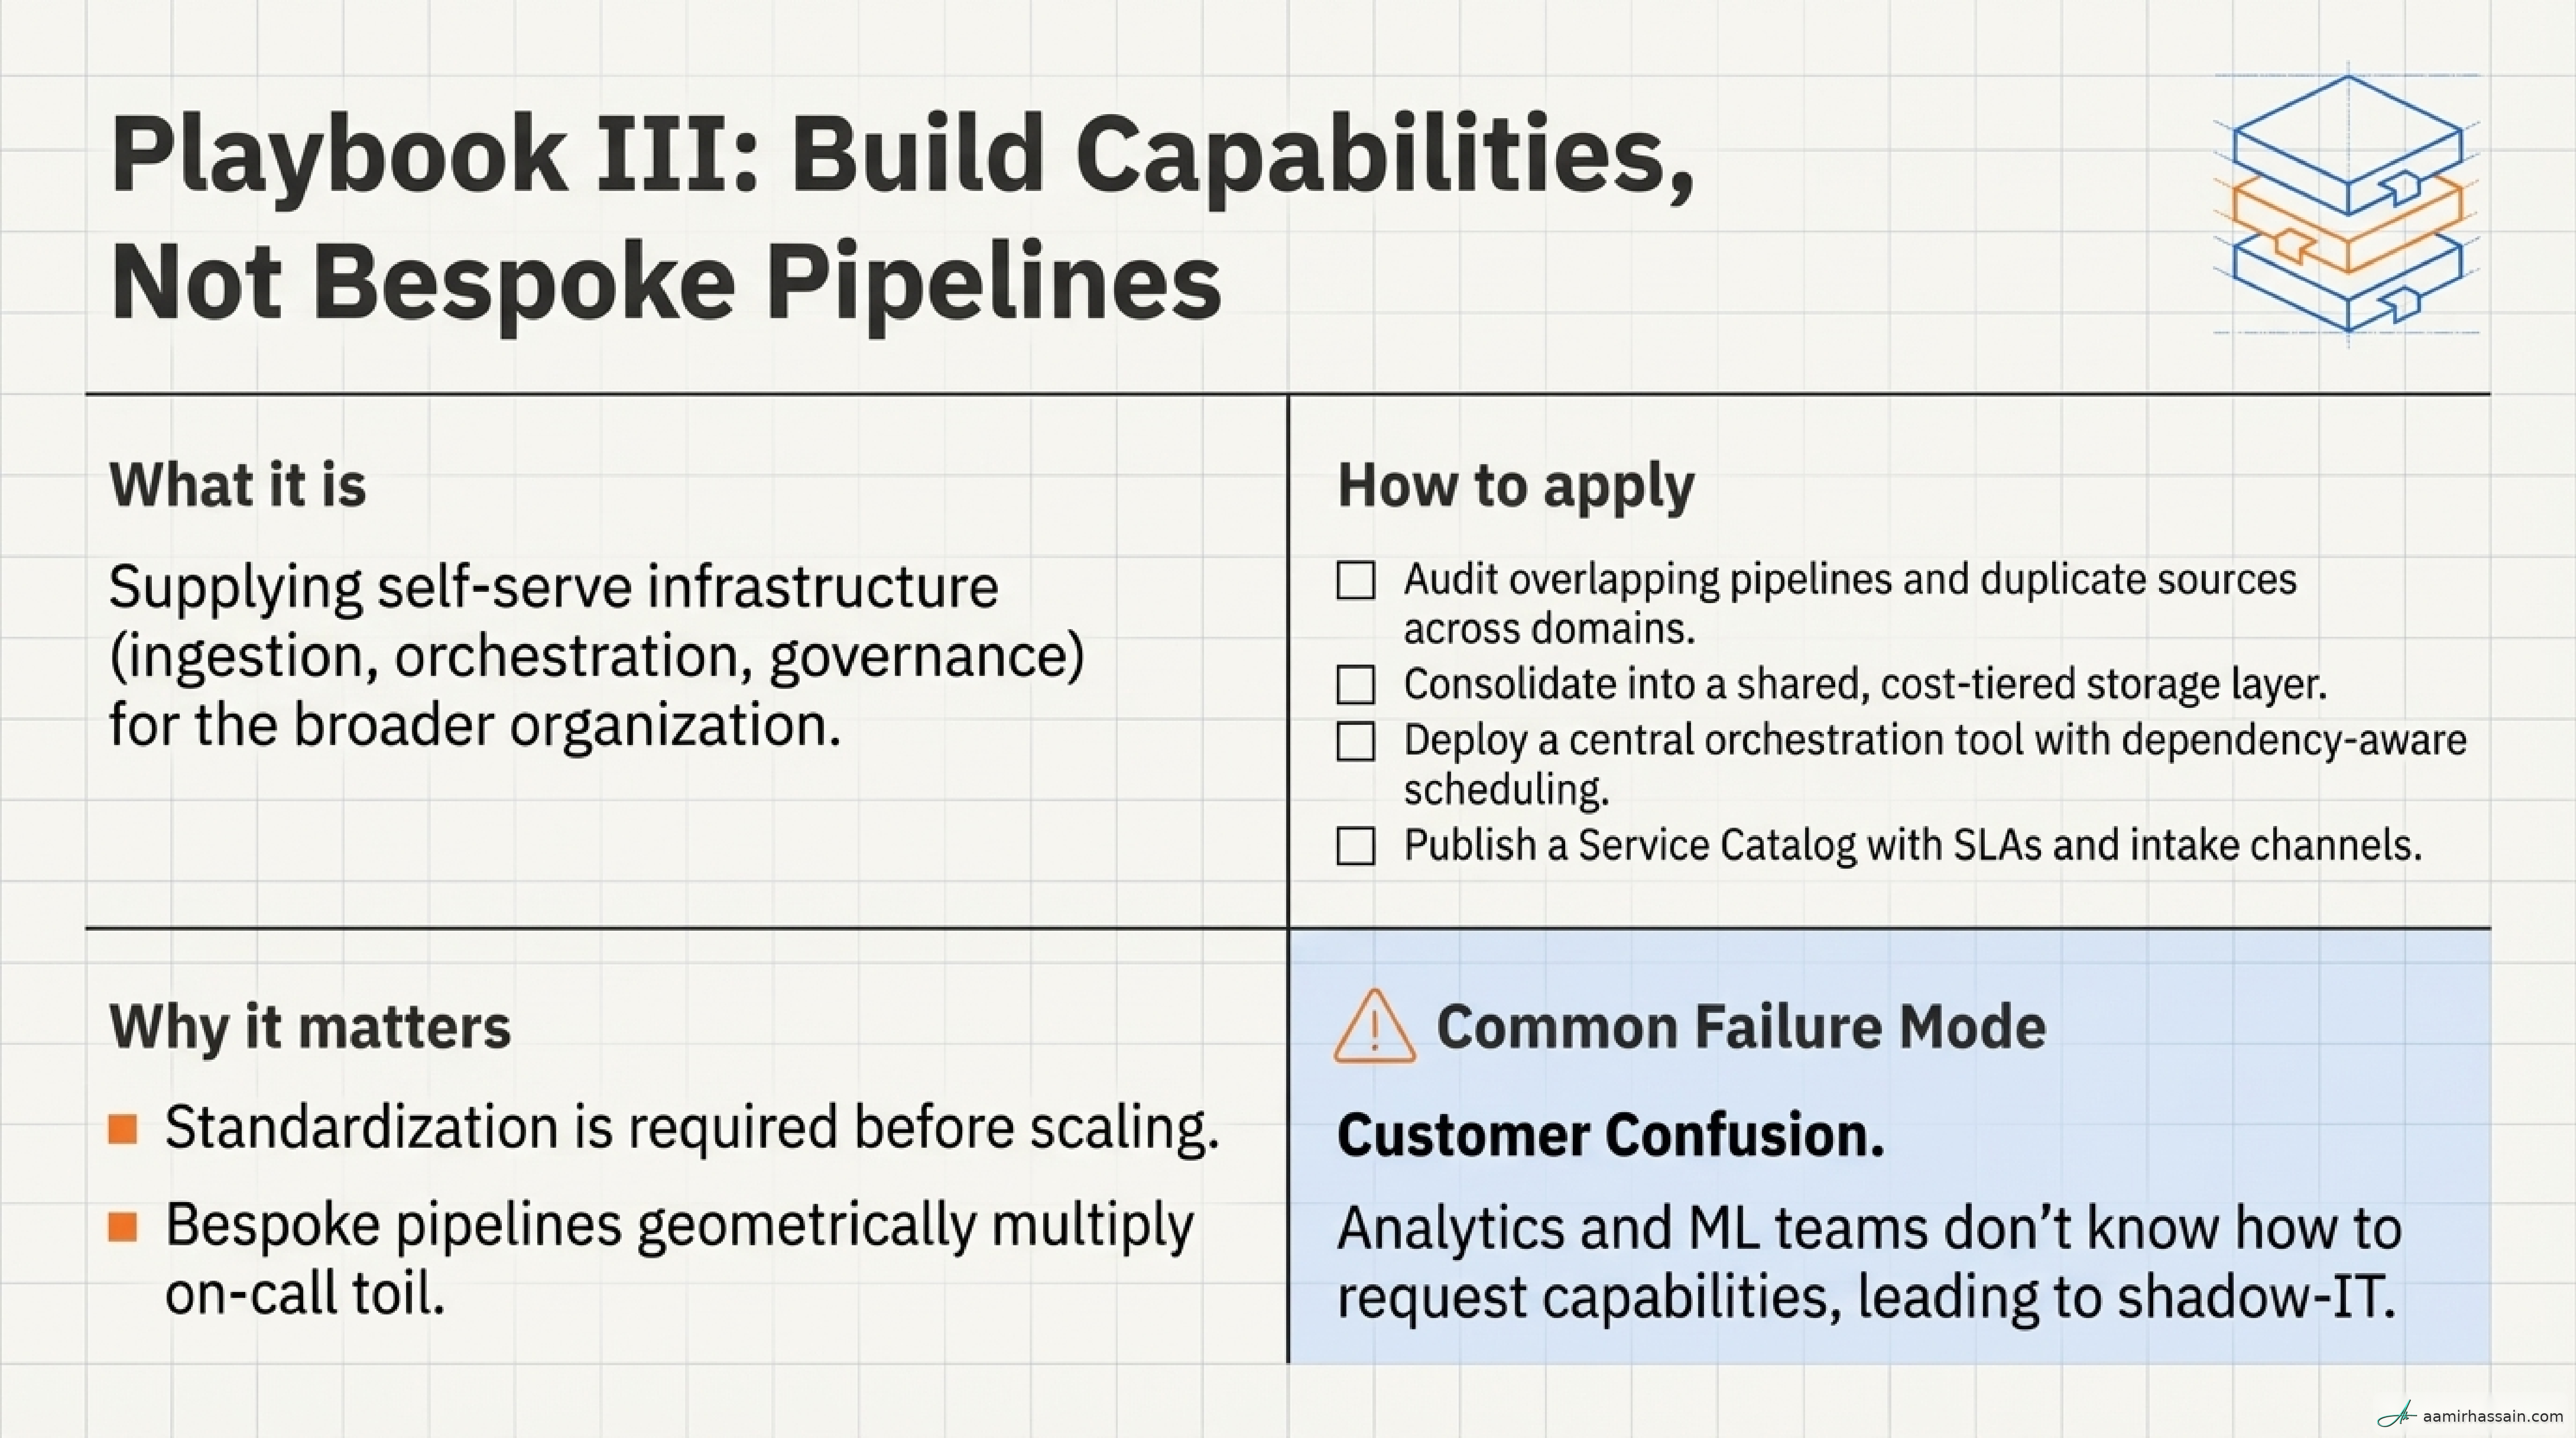
Failure mode: Customer confusion. When stakeholders do not know what to ask for, they ask for everything. Mitigation: publish a service catalog with capabilities, SLAs, and intake channels.
Establishing the Paved Road#
To scale, DE must shift from doing the work to providing the capability. This is the role of the paved road: standardized, repeatable workflows for common tasks such as ingestion, transformation, orchestration, and observability.
Checklist: Building the Golden Path#
- Standardize ingestion for both batch and streaming with built-in schema validation.
- Centralize storage around a single source of truth with sensible cost controls.
- Automate orchestration with dependency-aware scheduling, backfills, and owner-routed alerting.
- Implement observability for freshness, volume, and quality before attempting to scale.
- Enable self-serve workflows for simple onboarding and routine use cases.
- Formalize data contracts with schemas, SLAs, ownership, and change management.
What Good Looks Like#
- On-call toil drops because most pipelines run on standard, monitored infrastructure.
- New data sources are onboarded in days rather than weeks.
- The DE team spends more time improving the platform and less time manually unblocking requests.
Failure mode: Over-centralization. If every new table requires manual intervention from a DE engineer, the organization will stall. Mitigation: move from building pipelines for people to building platforms that let them self-serve safely.
Worked Example: The E-Commerce Consolidation#
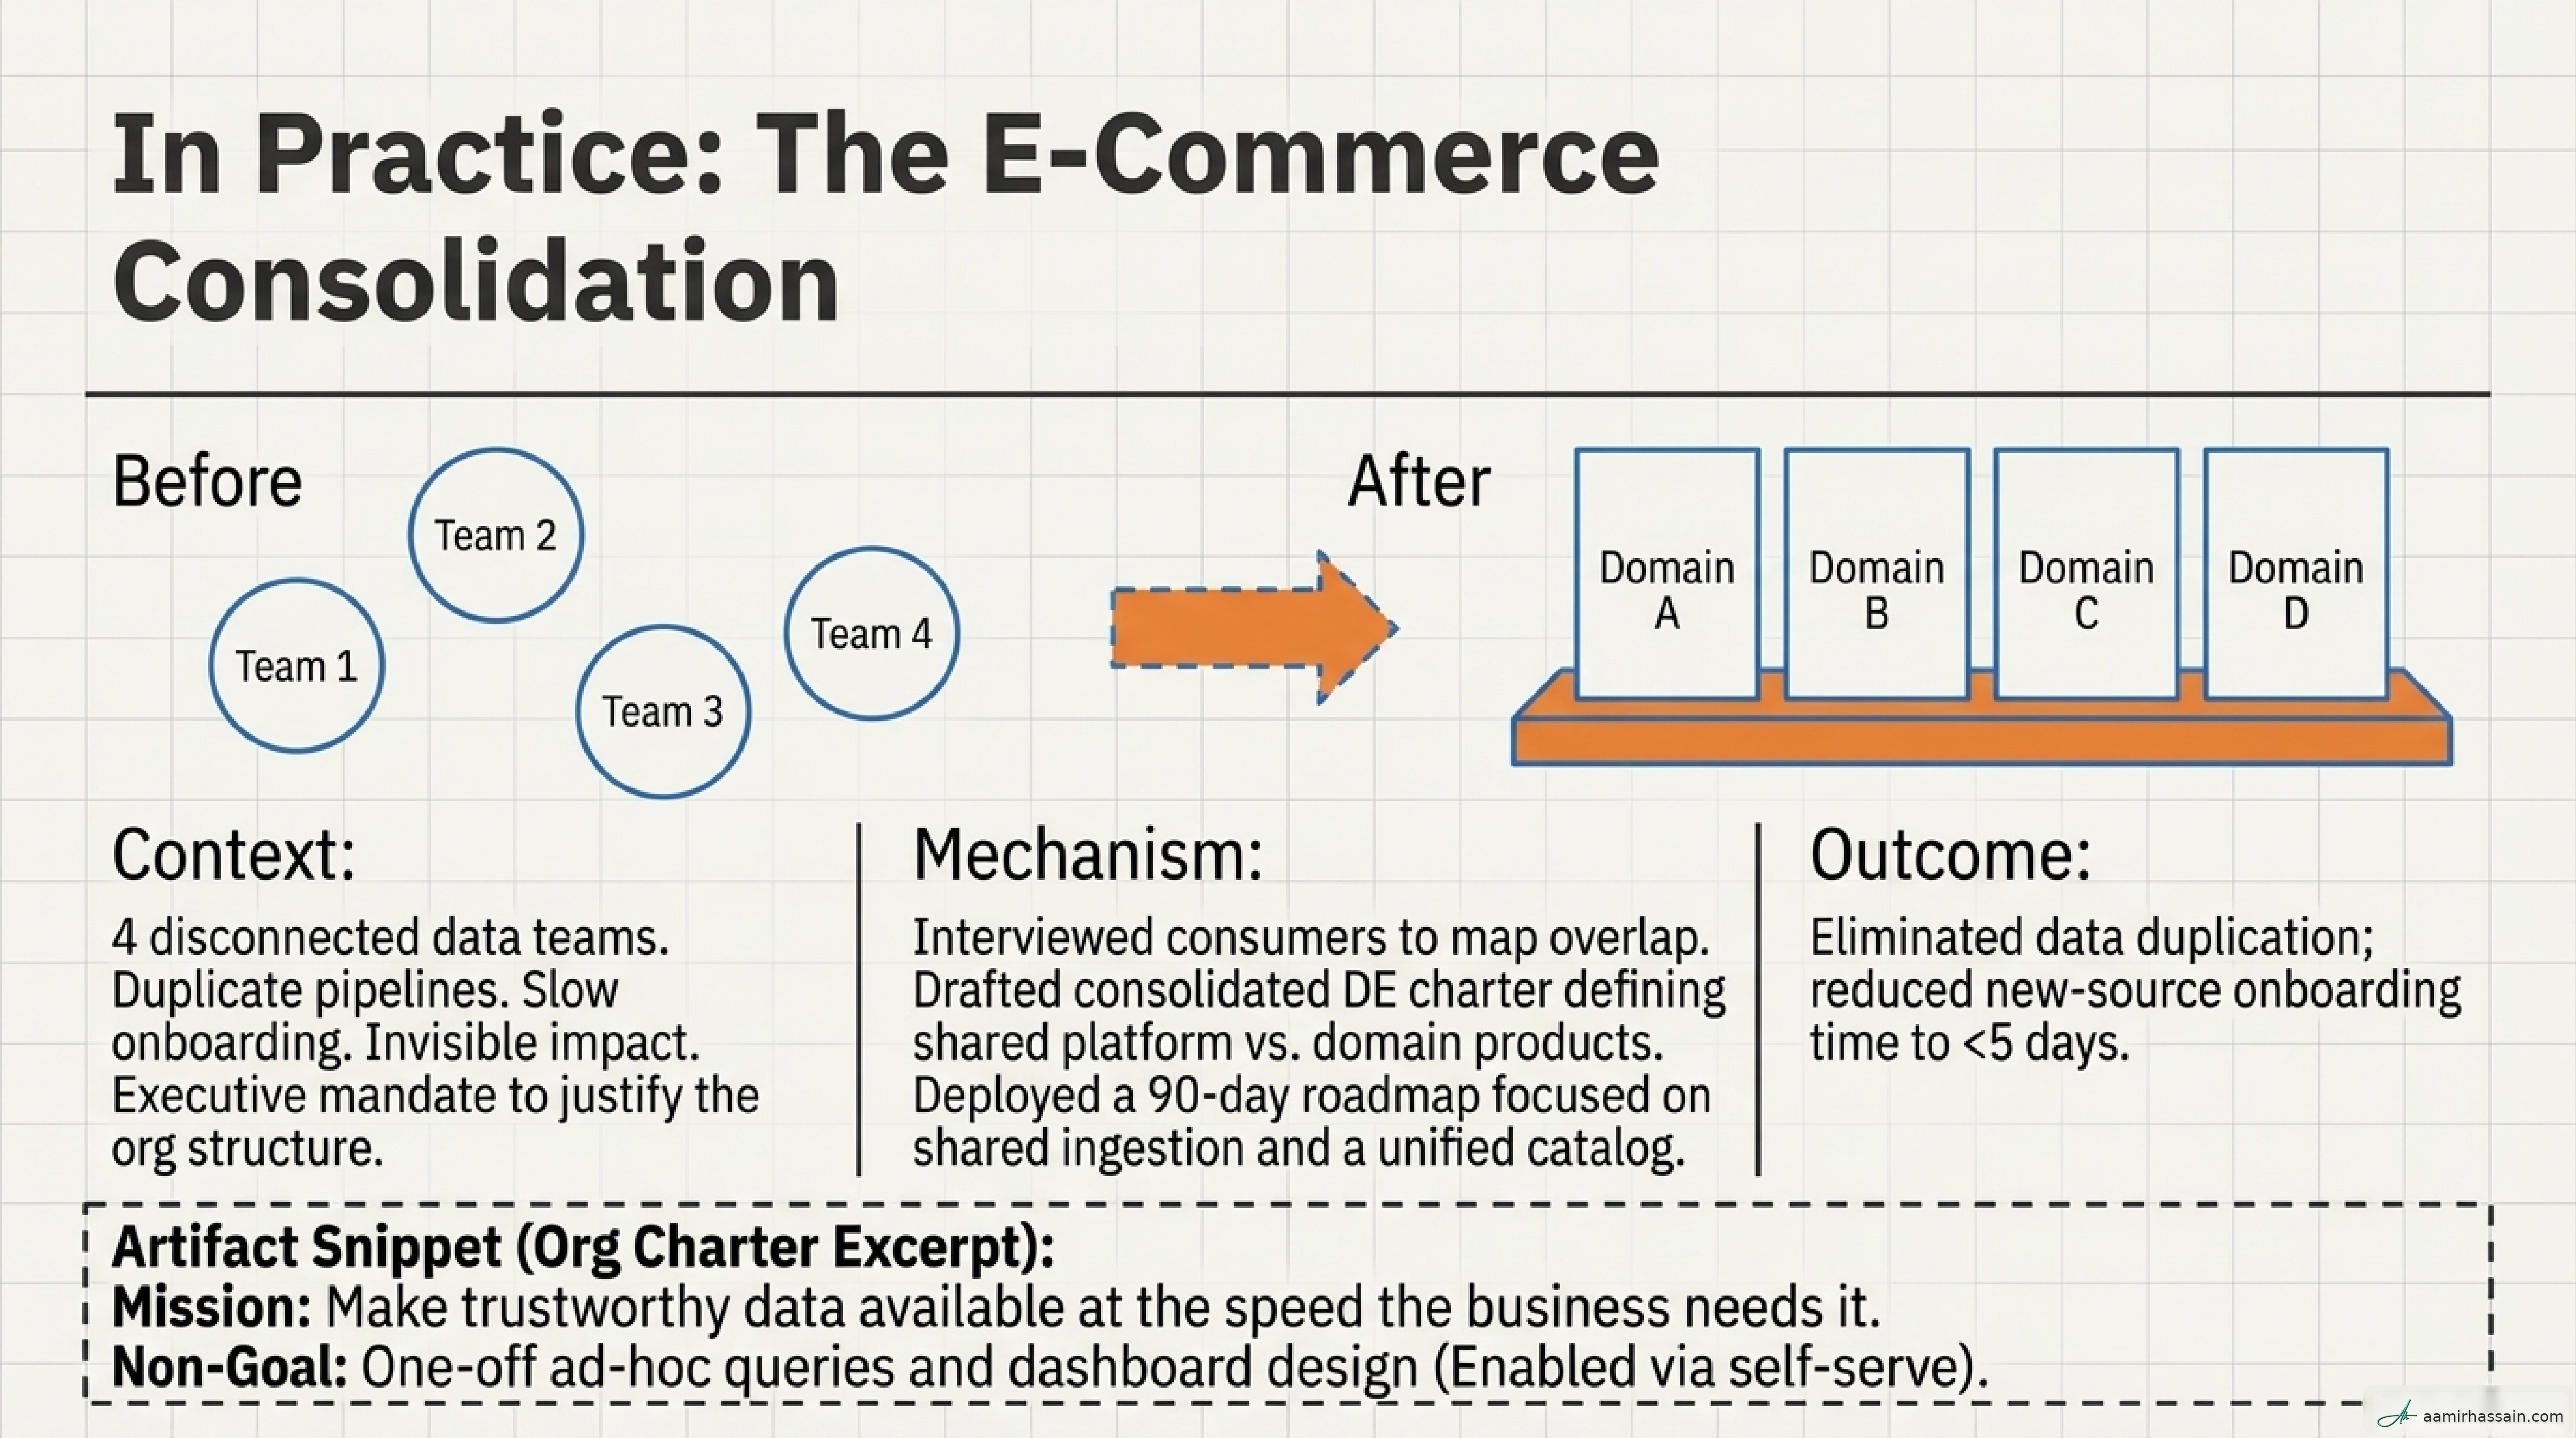
Context. A new Head of Data Engineering joins an e-commerce company with four disconnected data teams: Marketing Ops, ML, Finance BI, and core Analytics. Each team has its own Airflow instance, redundant ingestion pipelines for the same Shopify and NetSuite data, and onboarding times of more than 15 days. Leadership asks, “Why are we paying for four different data infrastructures?”
The strategic response. The leader interviews stakeholders, maps the overlapping infrastructure, and quantifies the cost of duplication in both cloud spend and engineering time. They propose a consolidated DE charter that centralizes platform capabilities while allowing domains to own their specific data products.
The 90-day roadmap.
- Quick wins (Days 1–30): Standardize shared ingestion for the top three sources—Shopify, ERP, and Ads—to eliminate duplicate API calls and sync errors.
- Medium wins (Days 31–60): Create a common warehouse schema for core entities such as Orders, Customers, and Products, then establish a unified orchestration layer.
- Long-term wins (Days 61–90): Launch a self-serve data catalog and automated onboarding documentation to reduce analyst requests for “where is this data?”
The outcome. Time to onboard new sources drops from 15 days to under 5. Incident rates for critical financial reports decrease by 40% because observability improves. The company saves 20% on cloud compute by eliminating redundant processing.
Artifact: DE Org Charter Excerpt
| Section | Content |
|---|---|
| Mission | We make trustworthy data available at the speed the business needs it. |
| Services | Ingestion, Storage, Orchestration, Transformation, Serving, Governance, Observability. |
| Success Metrics | Time-to-data (<4 hrs batch), Incident rate (≤2 P1/month), Self-serve adoption (≥60%). |
| Non-Goals | ML model training, dashboard design, ad-hoc queries, application DB operations. |
| How to Engage | Submit requests via the Intake Portal; Office Hours every Tuesday at 2 PM. |
Metrics That Prove It#
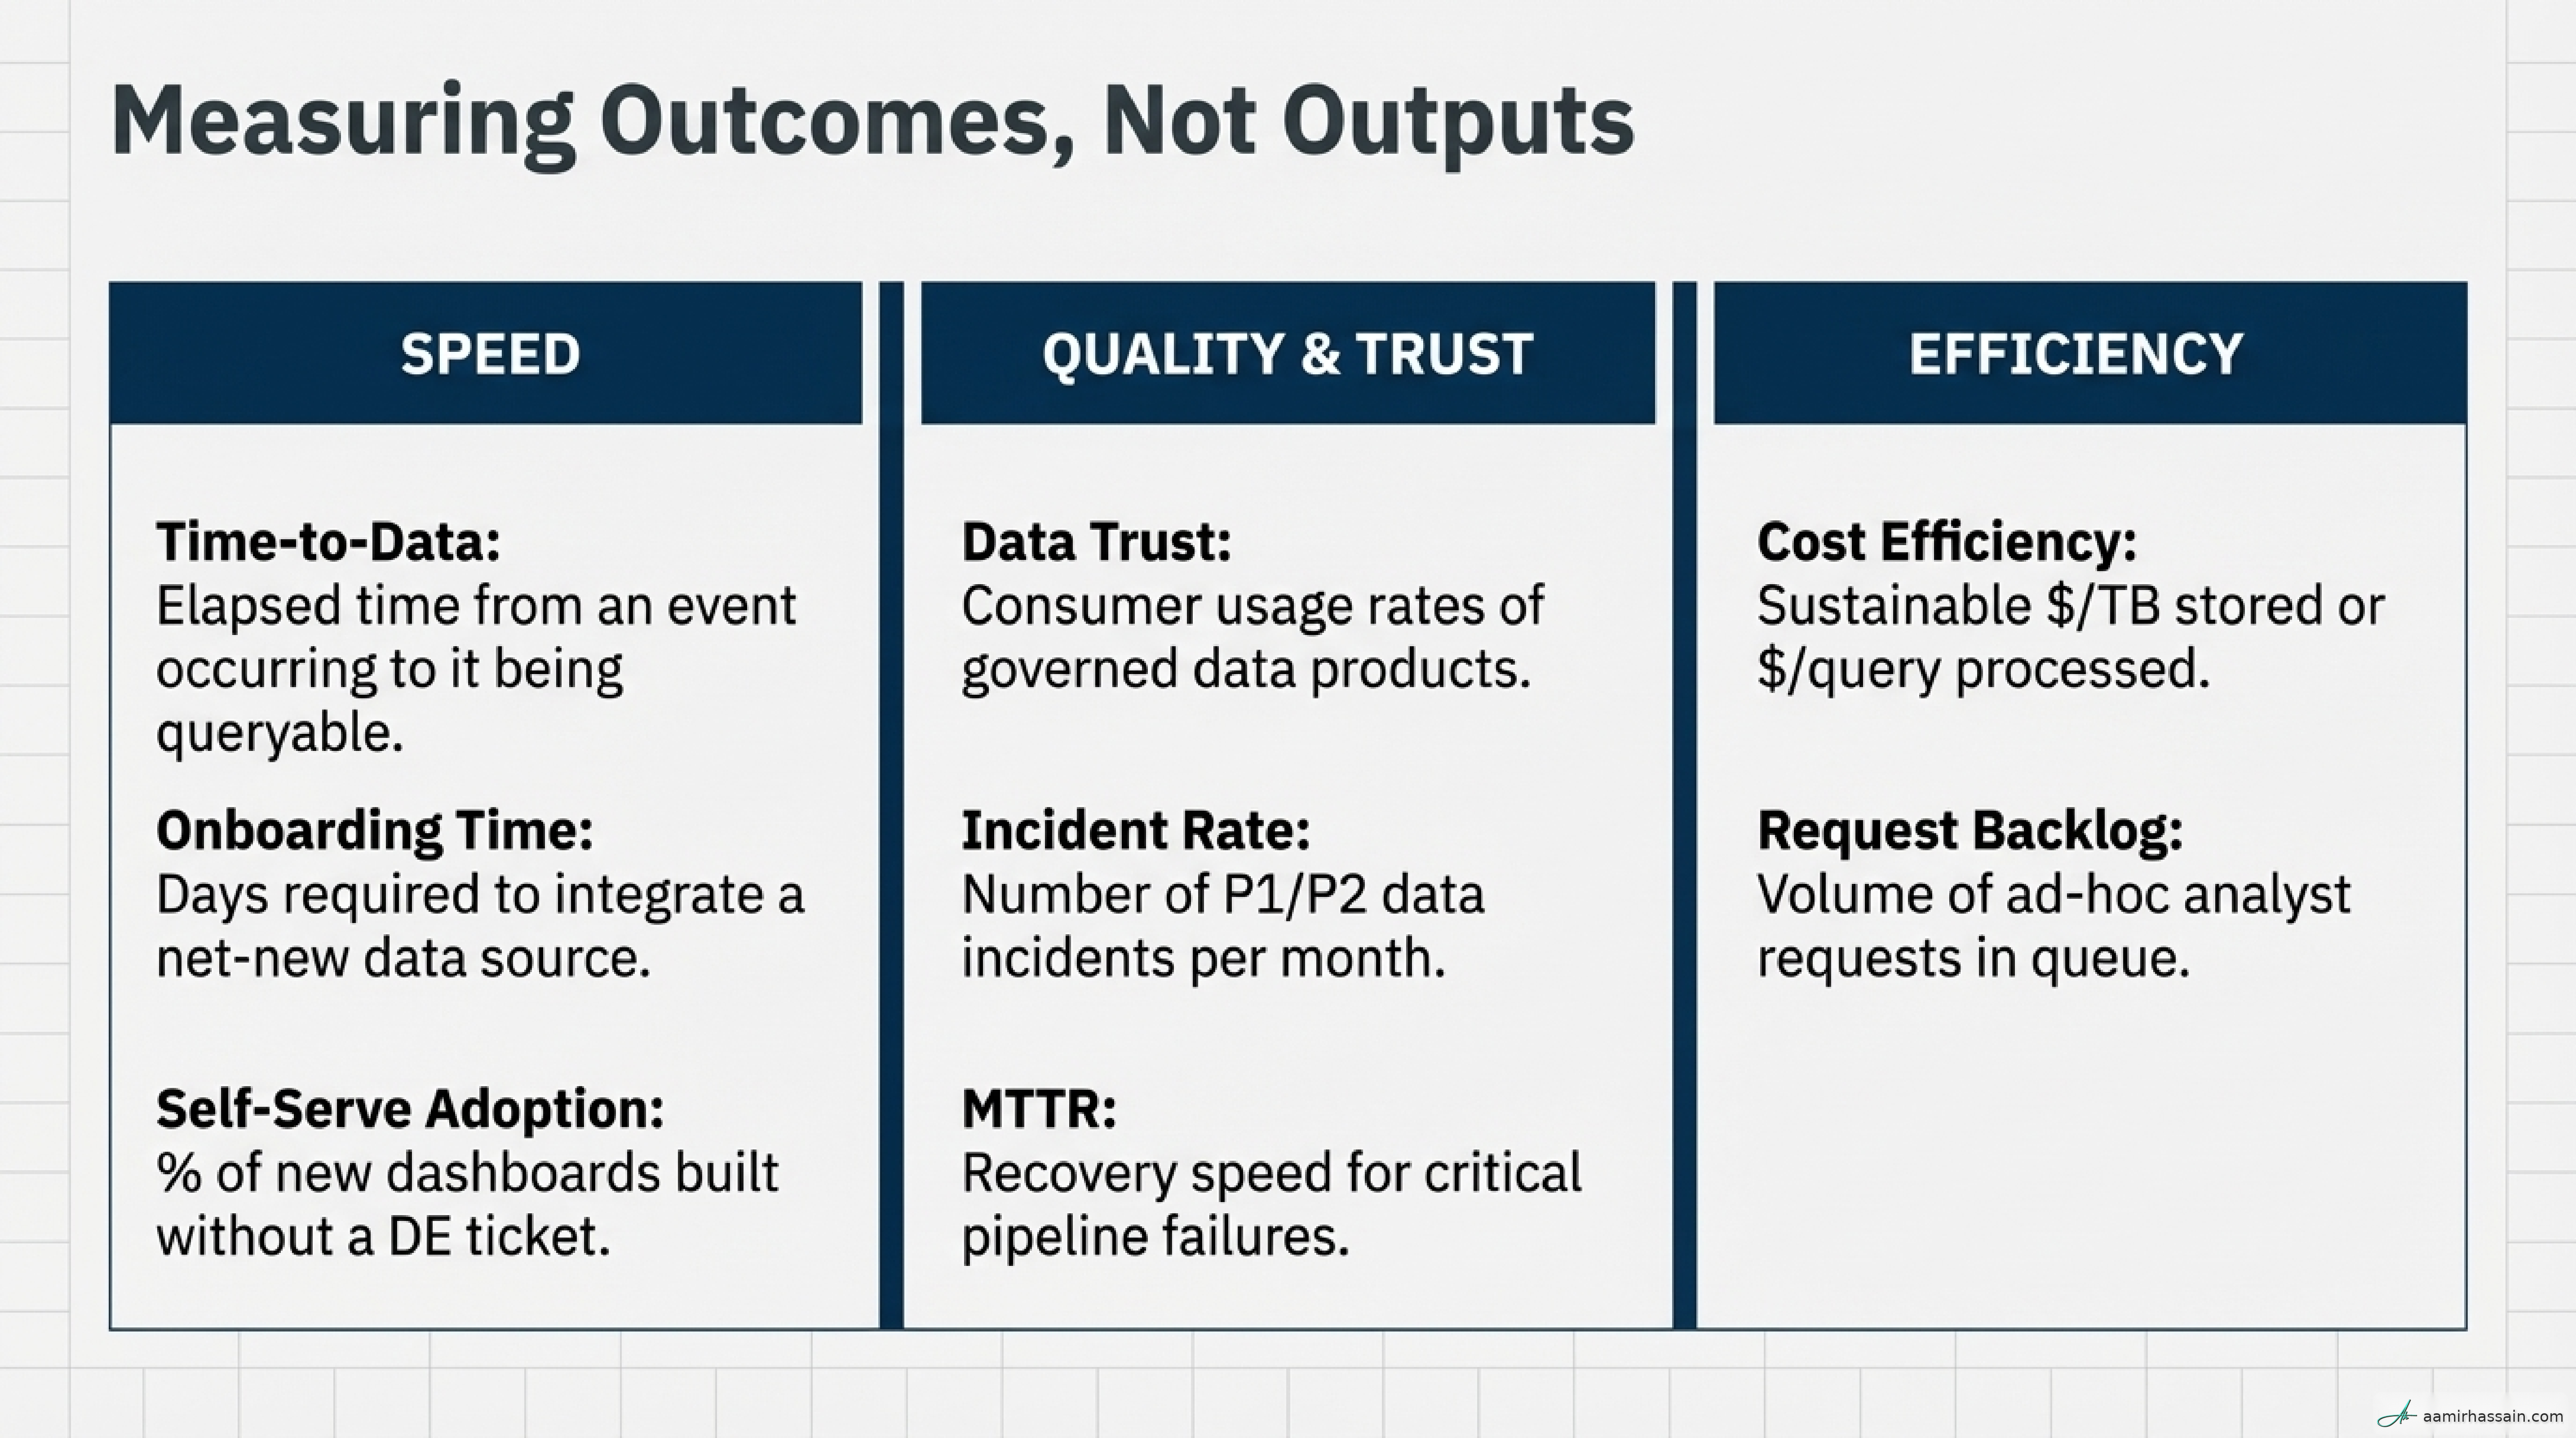
To earn trust, measure what matters to the business. Use a scoreboard like this to track organizational health and defend your budget.
| Metric | Definition | Why It Matters | Target / “Good” |
|---|---|---|---|
| Time-to-data | Elapsed time from event to queryable data | Measures freshness and business agility | <4 hrs (batch) |
| Incident rate | Number of P1/P2 data incidents per month | Measures reliability and consumer trust | ≤2 per month |
| Onboarding time | Days required to add a new data source | Measures platform efficiency and speed | ≤5 days |
| Self-serve adoption | Percentage of dashboards built without a DE ticket | If this is low, DE remains a bottleneck | ≥60% |
| Cost efficiency | Cost per TB stored or processed | If leadership cannot see cost control, budget is at risk | Stable or down |
| Data trust | Percentage of datasets with documented owners and SLAs | Measures governance and confidence in insights | ≥90% |
Leadership Language#
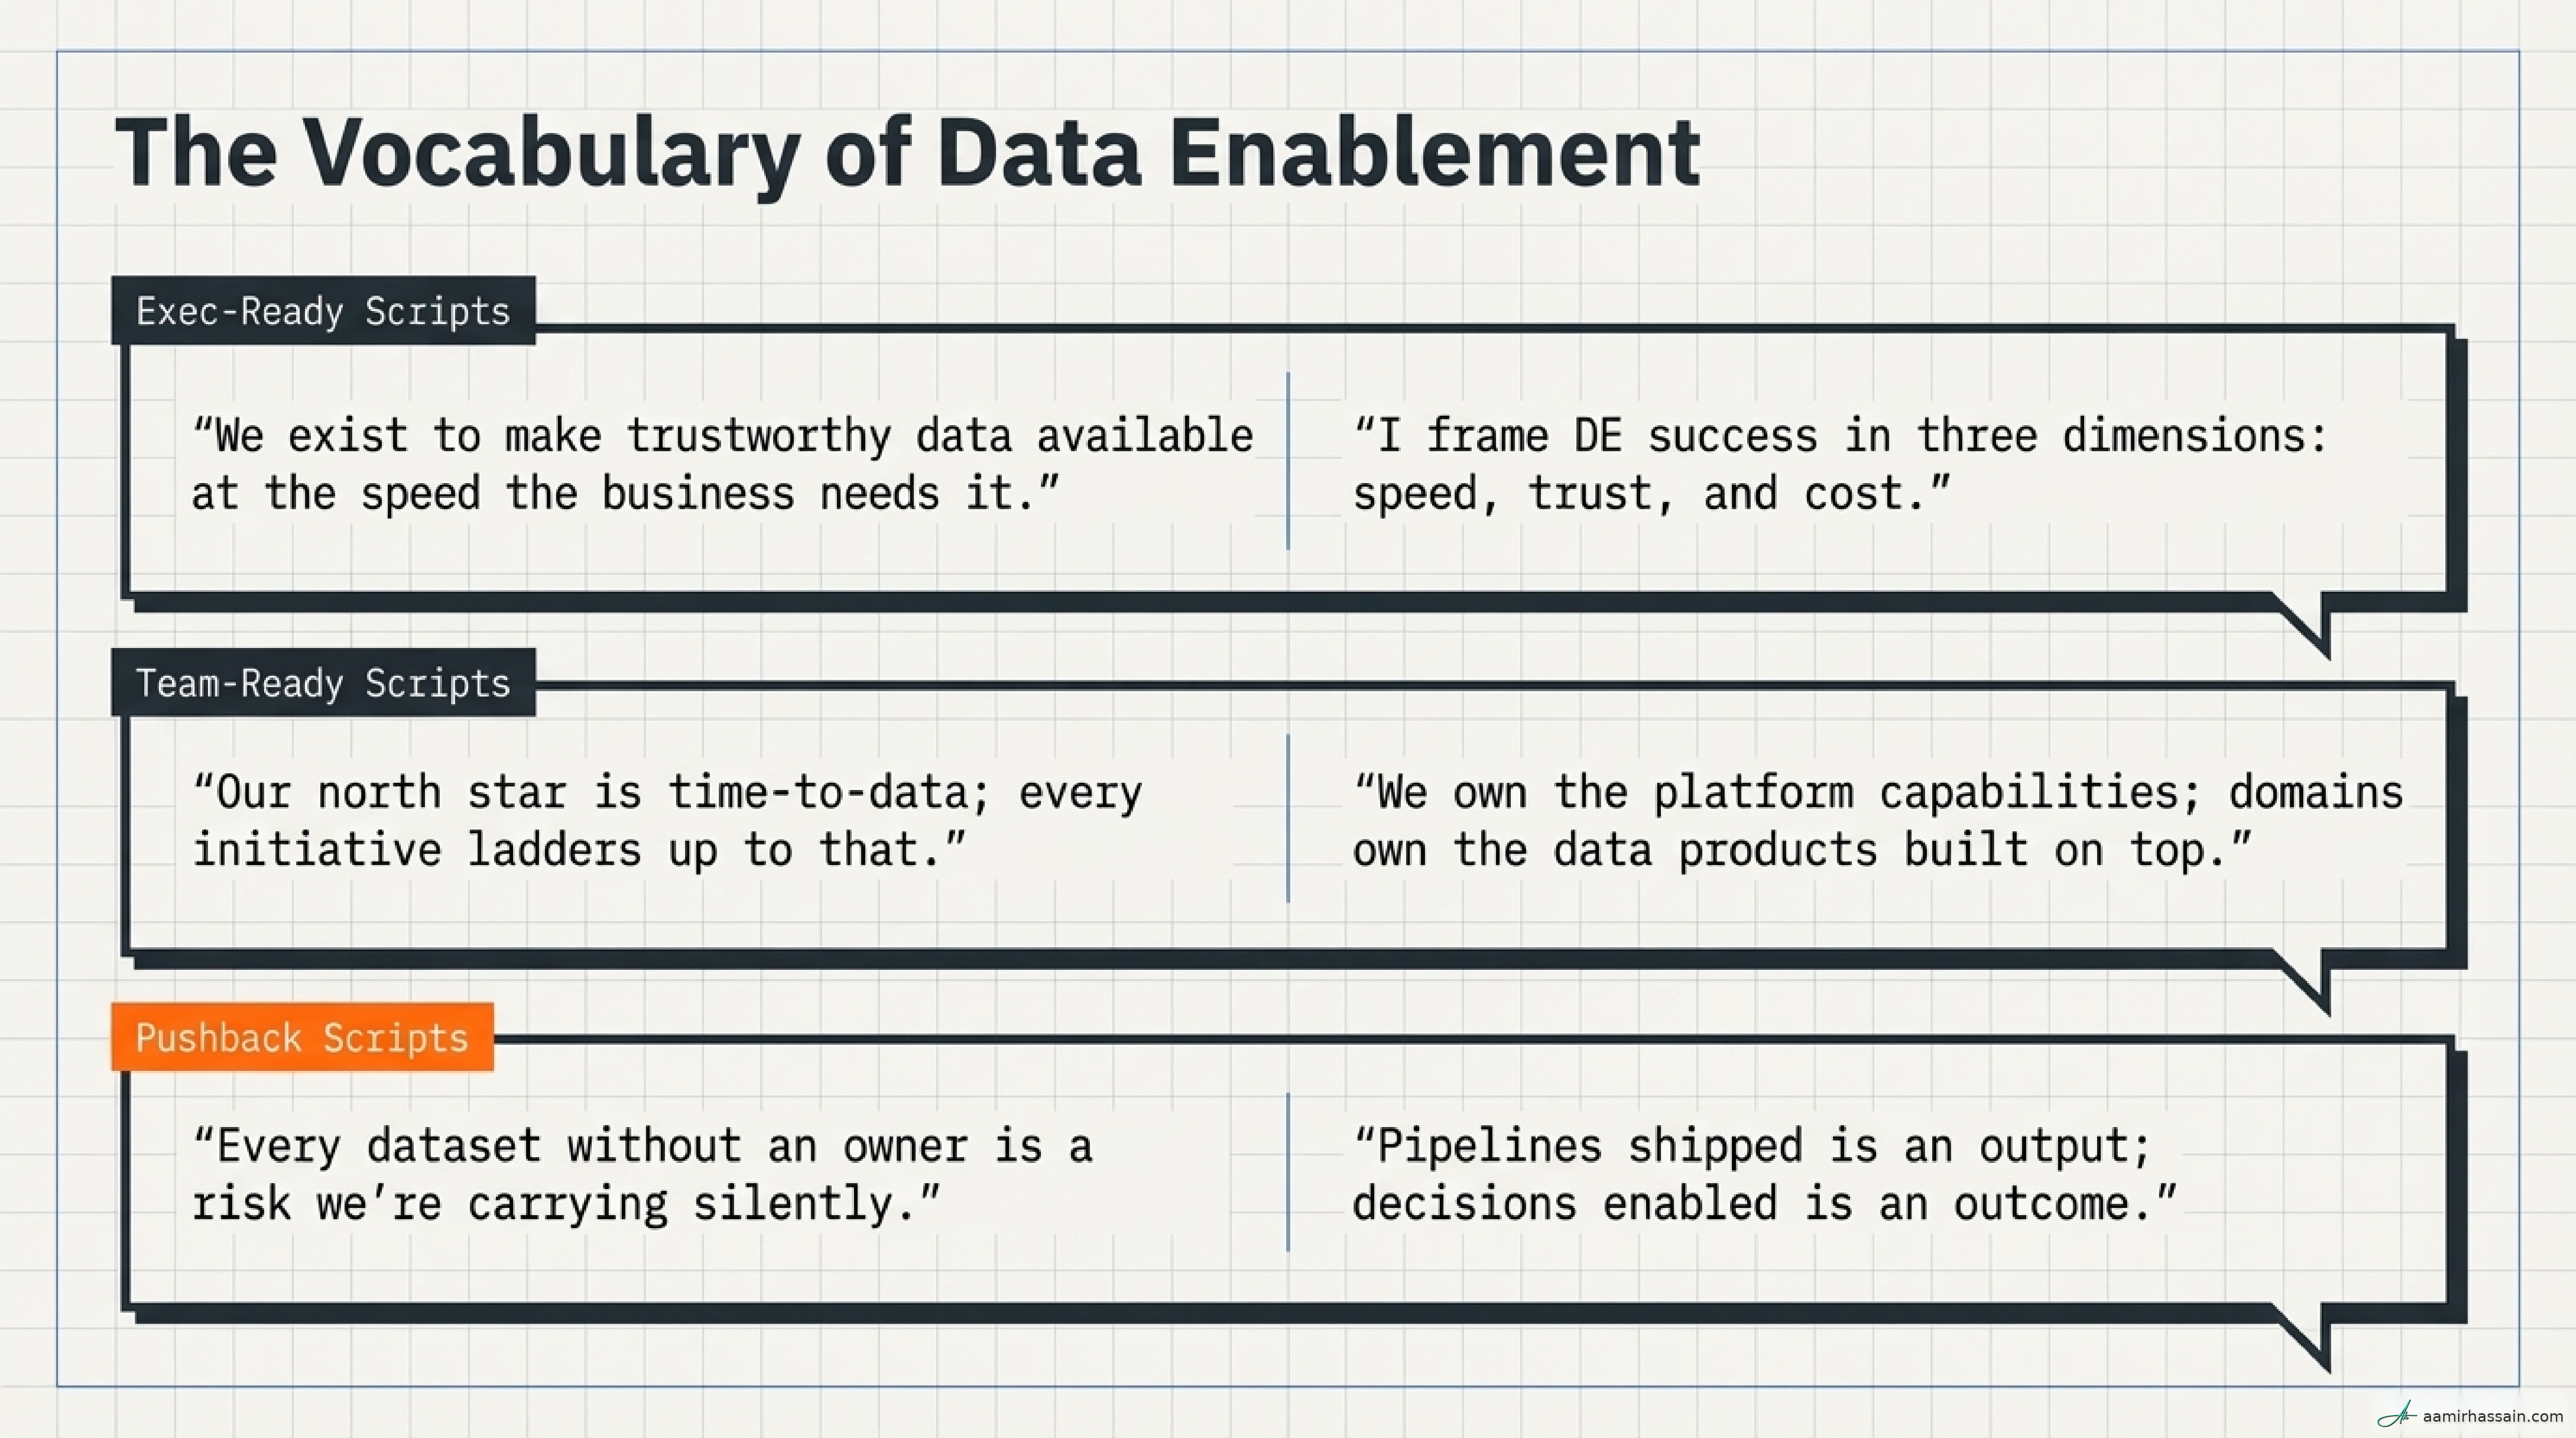
The way you speak determines how you are perceived. Move from technical jargon to value-based language.
Executive-Ready Sentences#
- “Our north star is time-to-data; every initiative we take ladders up to making data usable faster.”
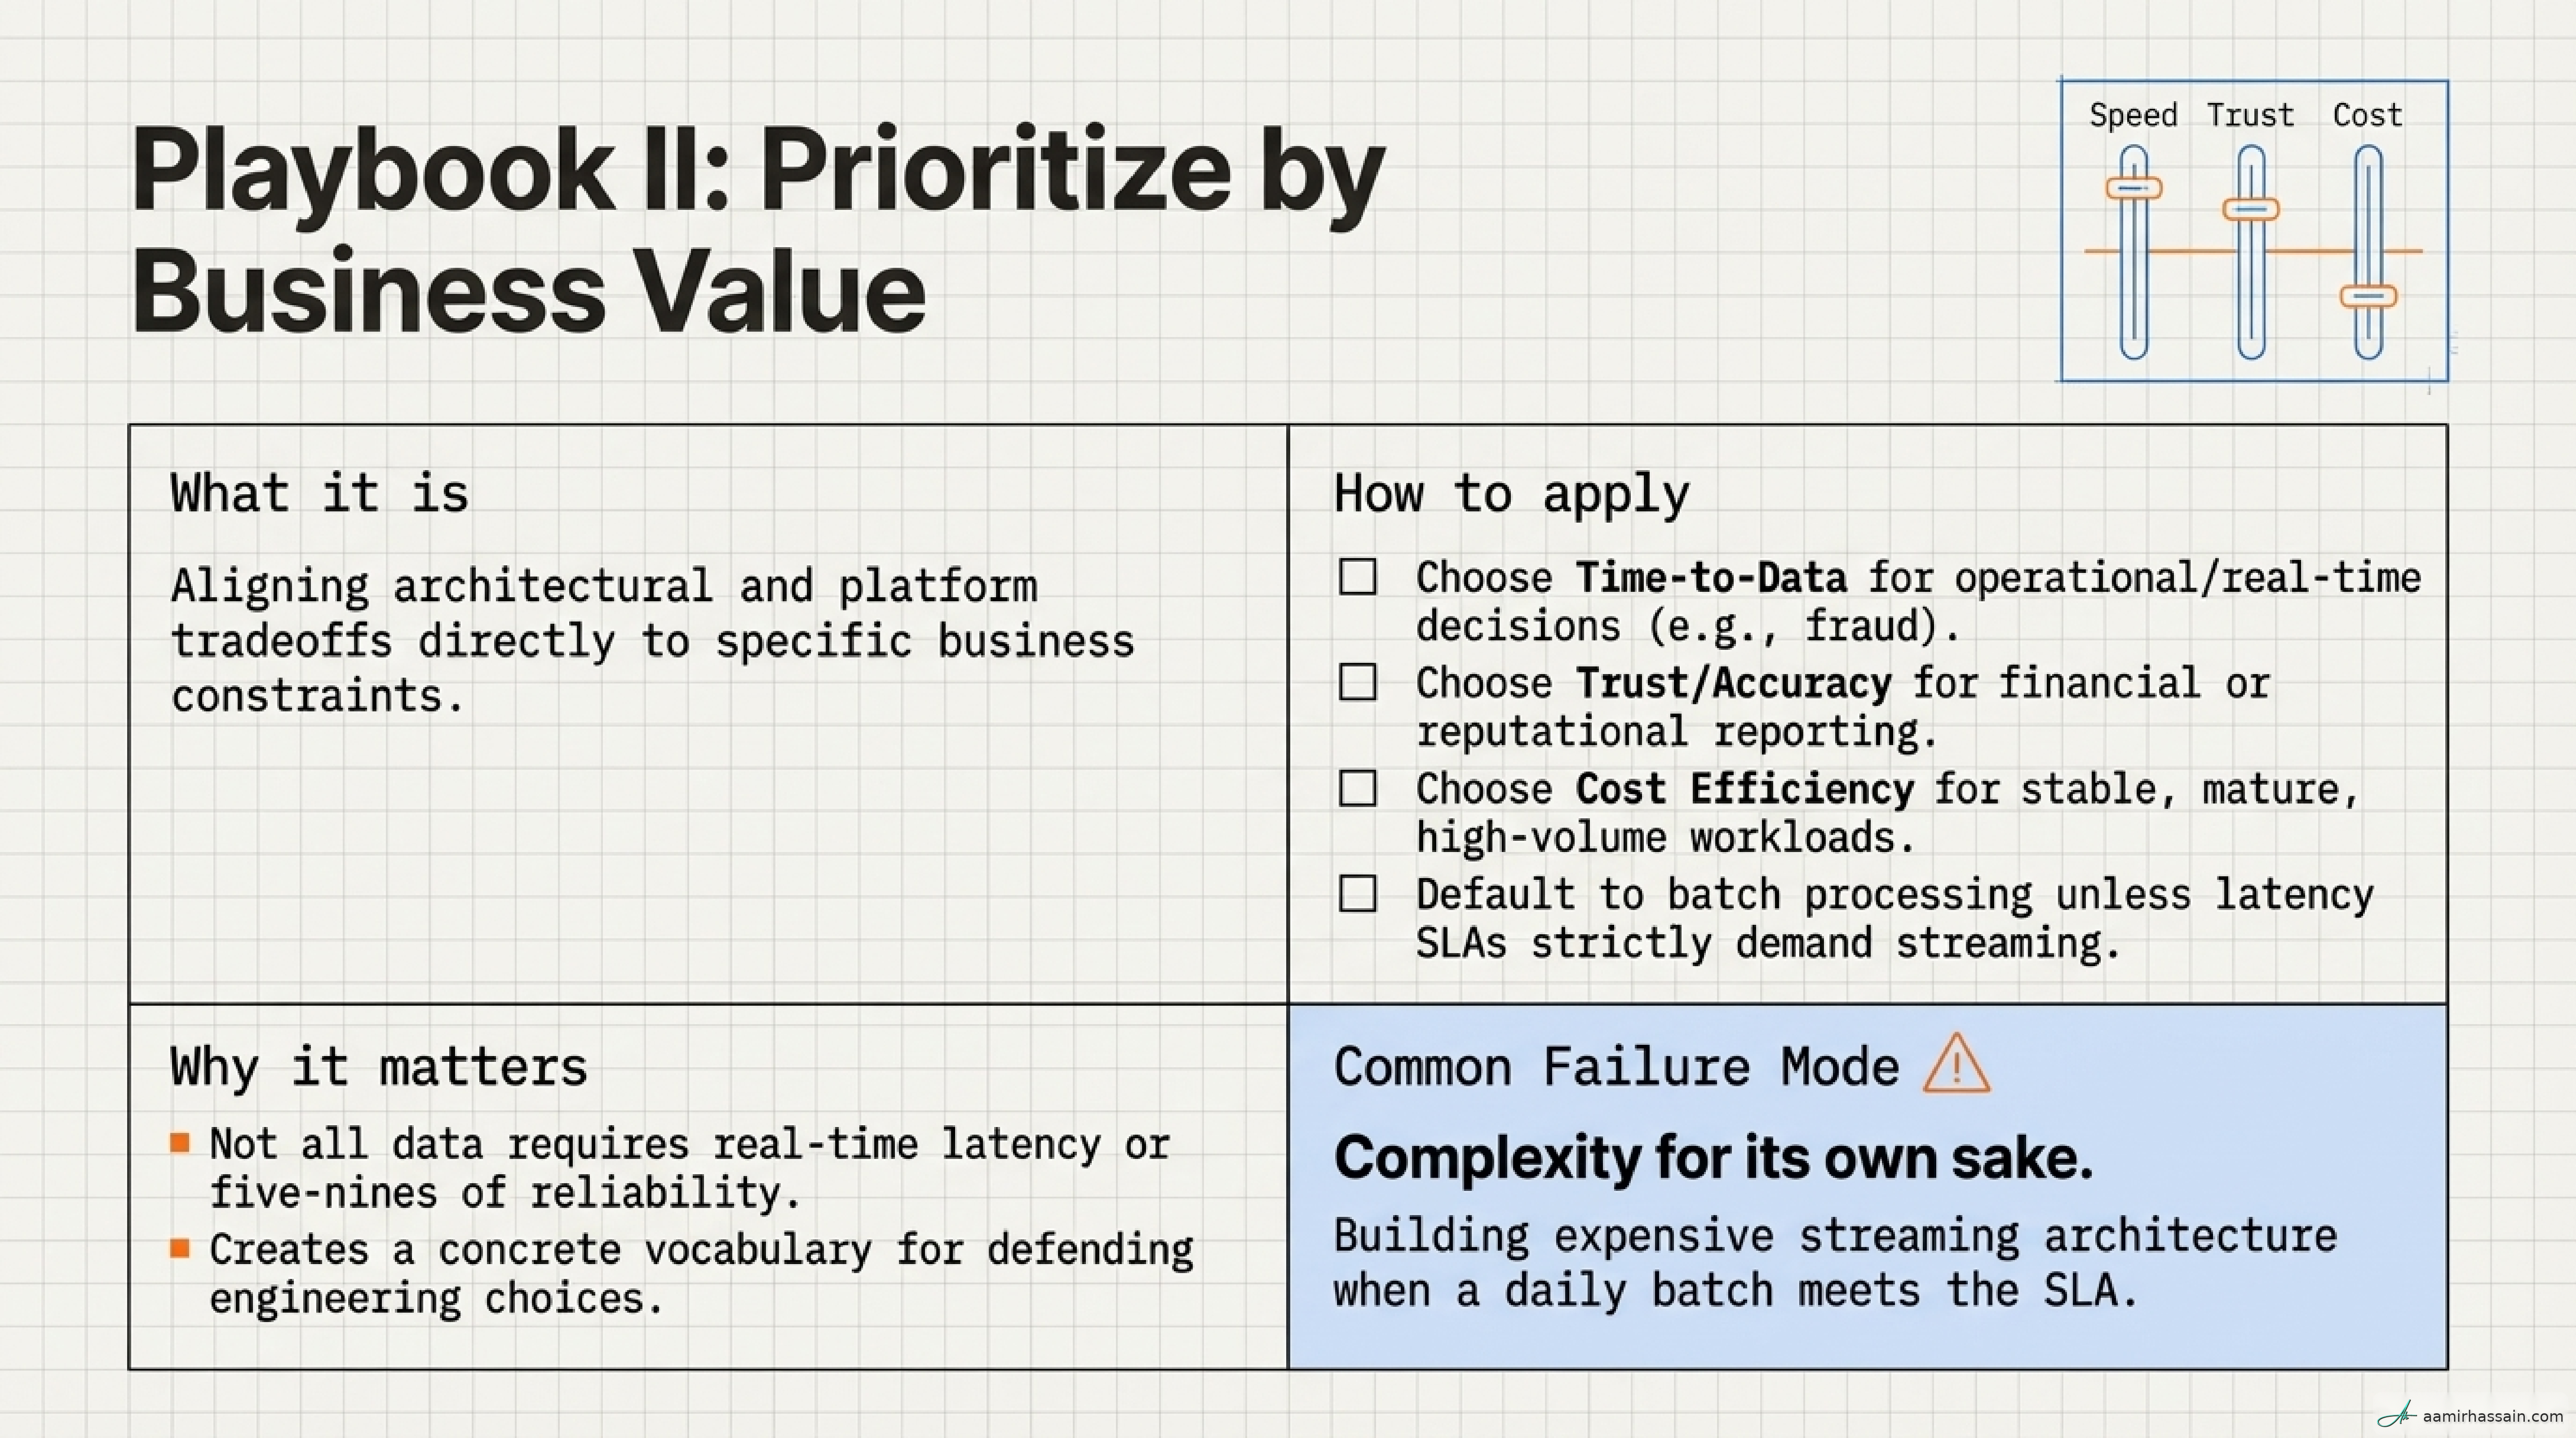
- “We frame DE success in three dimensions: speed, trust, and cost efficiency.”
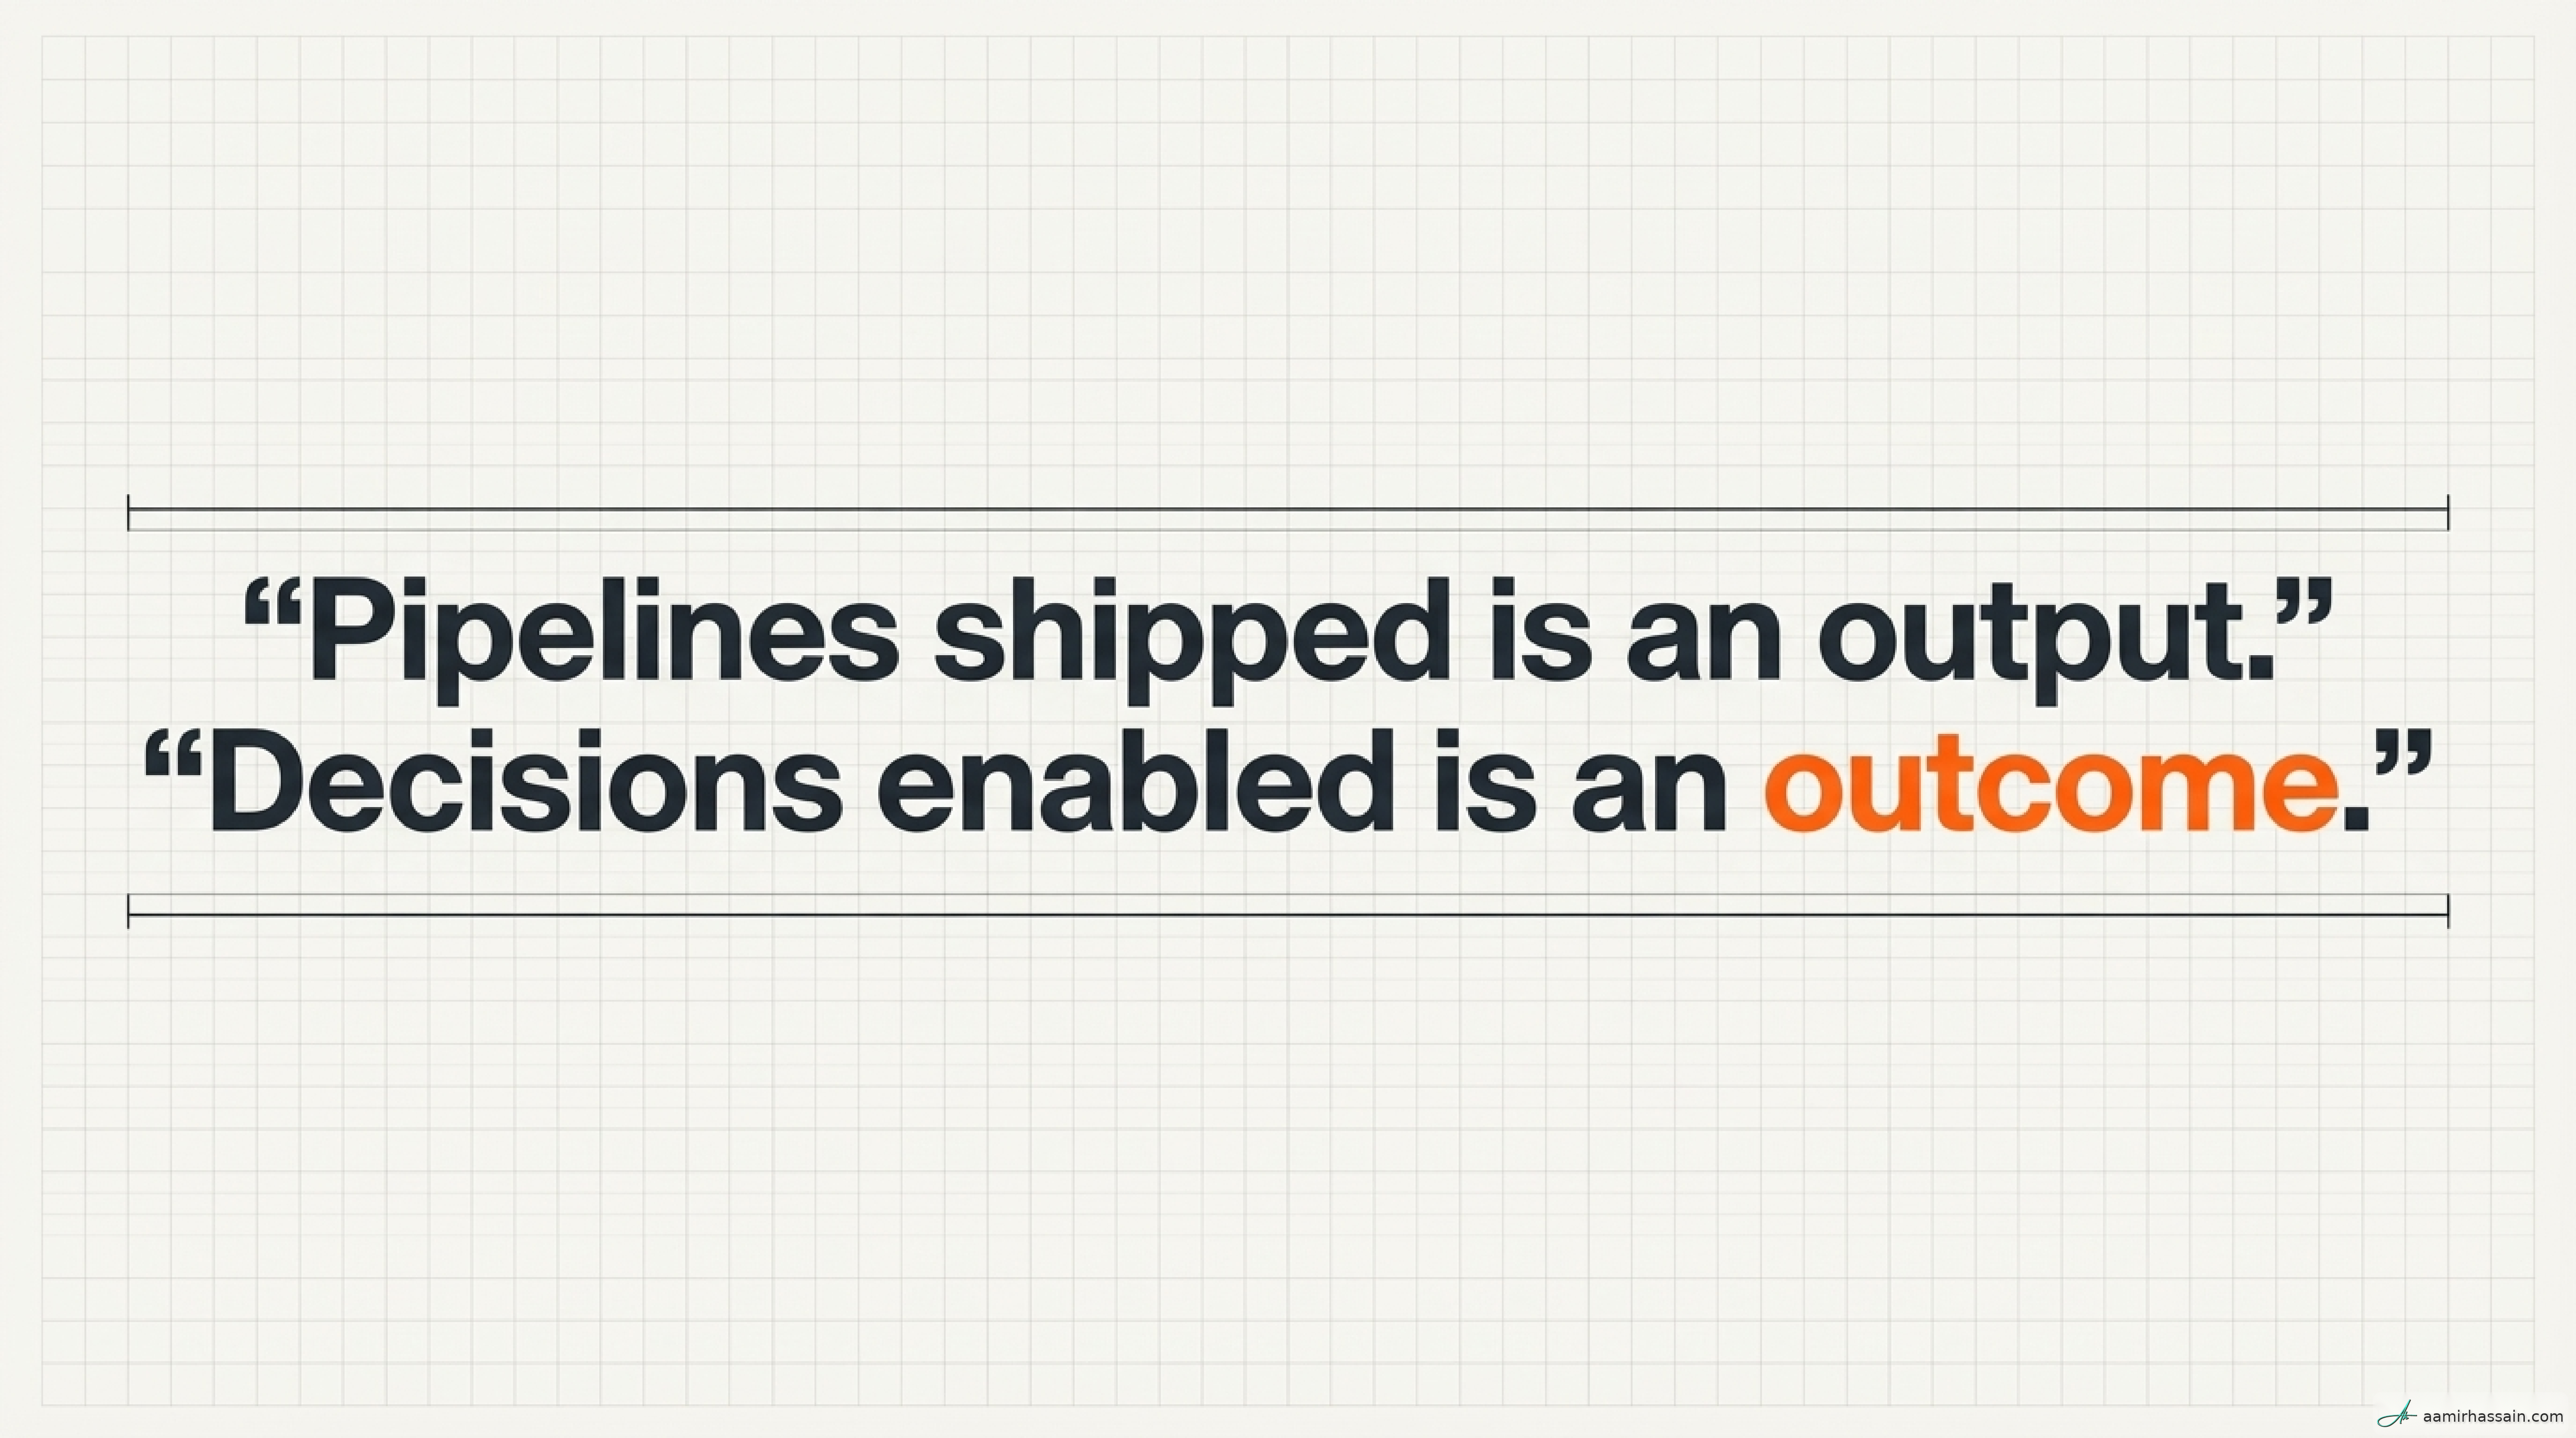
- “Pipelines shipped is an output; decisions enabled is the outcome we care about.”
- “If the business cannot see the value we provide, we have not made it visible enough—and that is our responsibility.”
- “Every dataset without an explicit owner is a risk we are carrying silently on our balance sheet.”
Team-Ready Sentences#
- “We own the platform capabilities; the domains own the data products built on top of them.”
- “Invest in observability before you scale; you cannot run what you cannot see.”
- “Standardize before you scale; bespoke pipelines only multiply our on-call toil.”
- “We exist to enable the business, not just to move bytes from point A to point B.”
- “Our goal is to build the paved road so other teams can move fast without breaking the warehouse.”
Pushback Scripts#
- On scope creep: “That request falls under dashboard design, which is a non-goal in our charter. We can, however, provide the paved road and modeled data for your team to build it themselves.”
- On data ownership: “We can ingest this data, but we need a domain owner to sign the data contract and define SLAs before this goes into production.”
- On ad-hoc requests: “To maintain focus on high-impact outcomes such as reducing time-to-data, we handle ad-hoc requests through our intake process rather than Slack.”
Common Mistakes to Avoid#
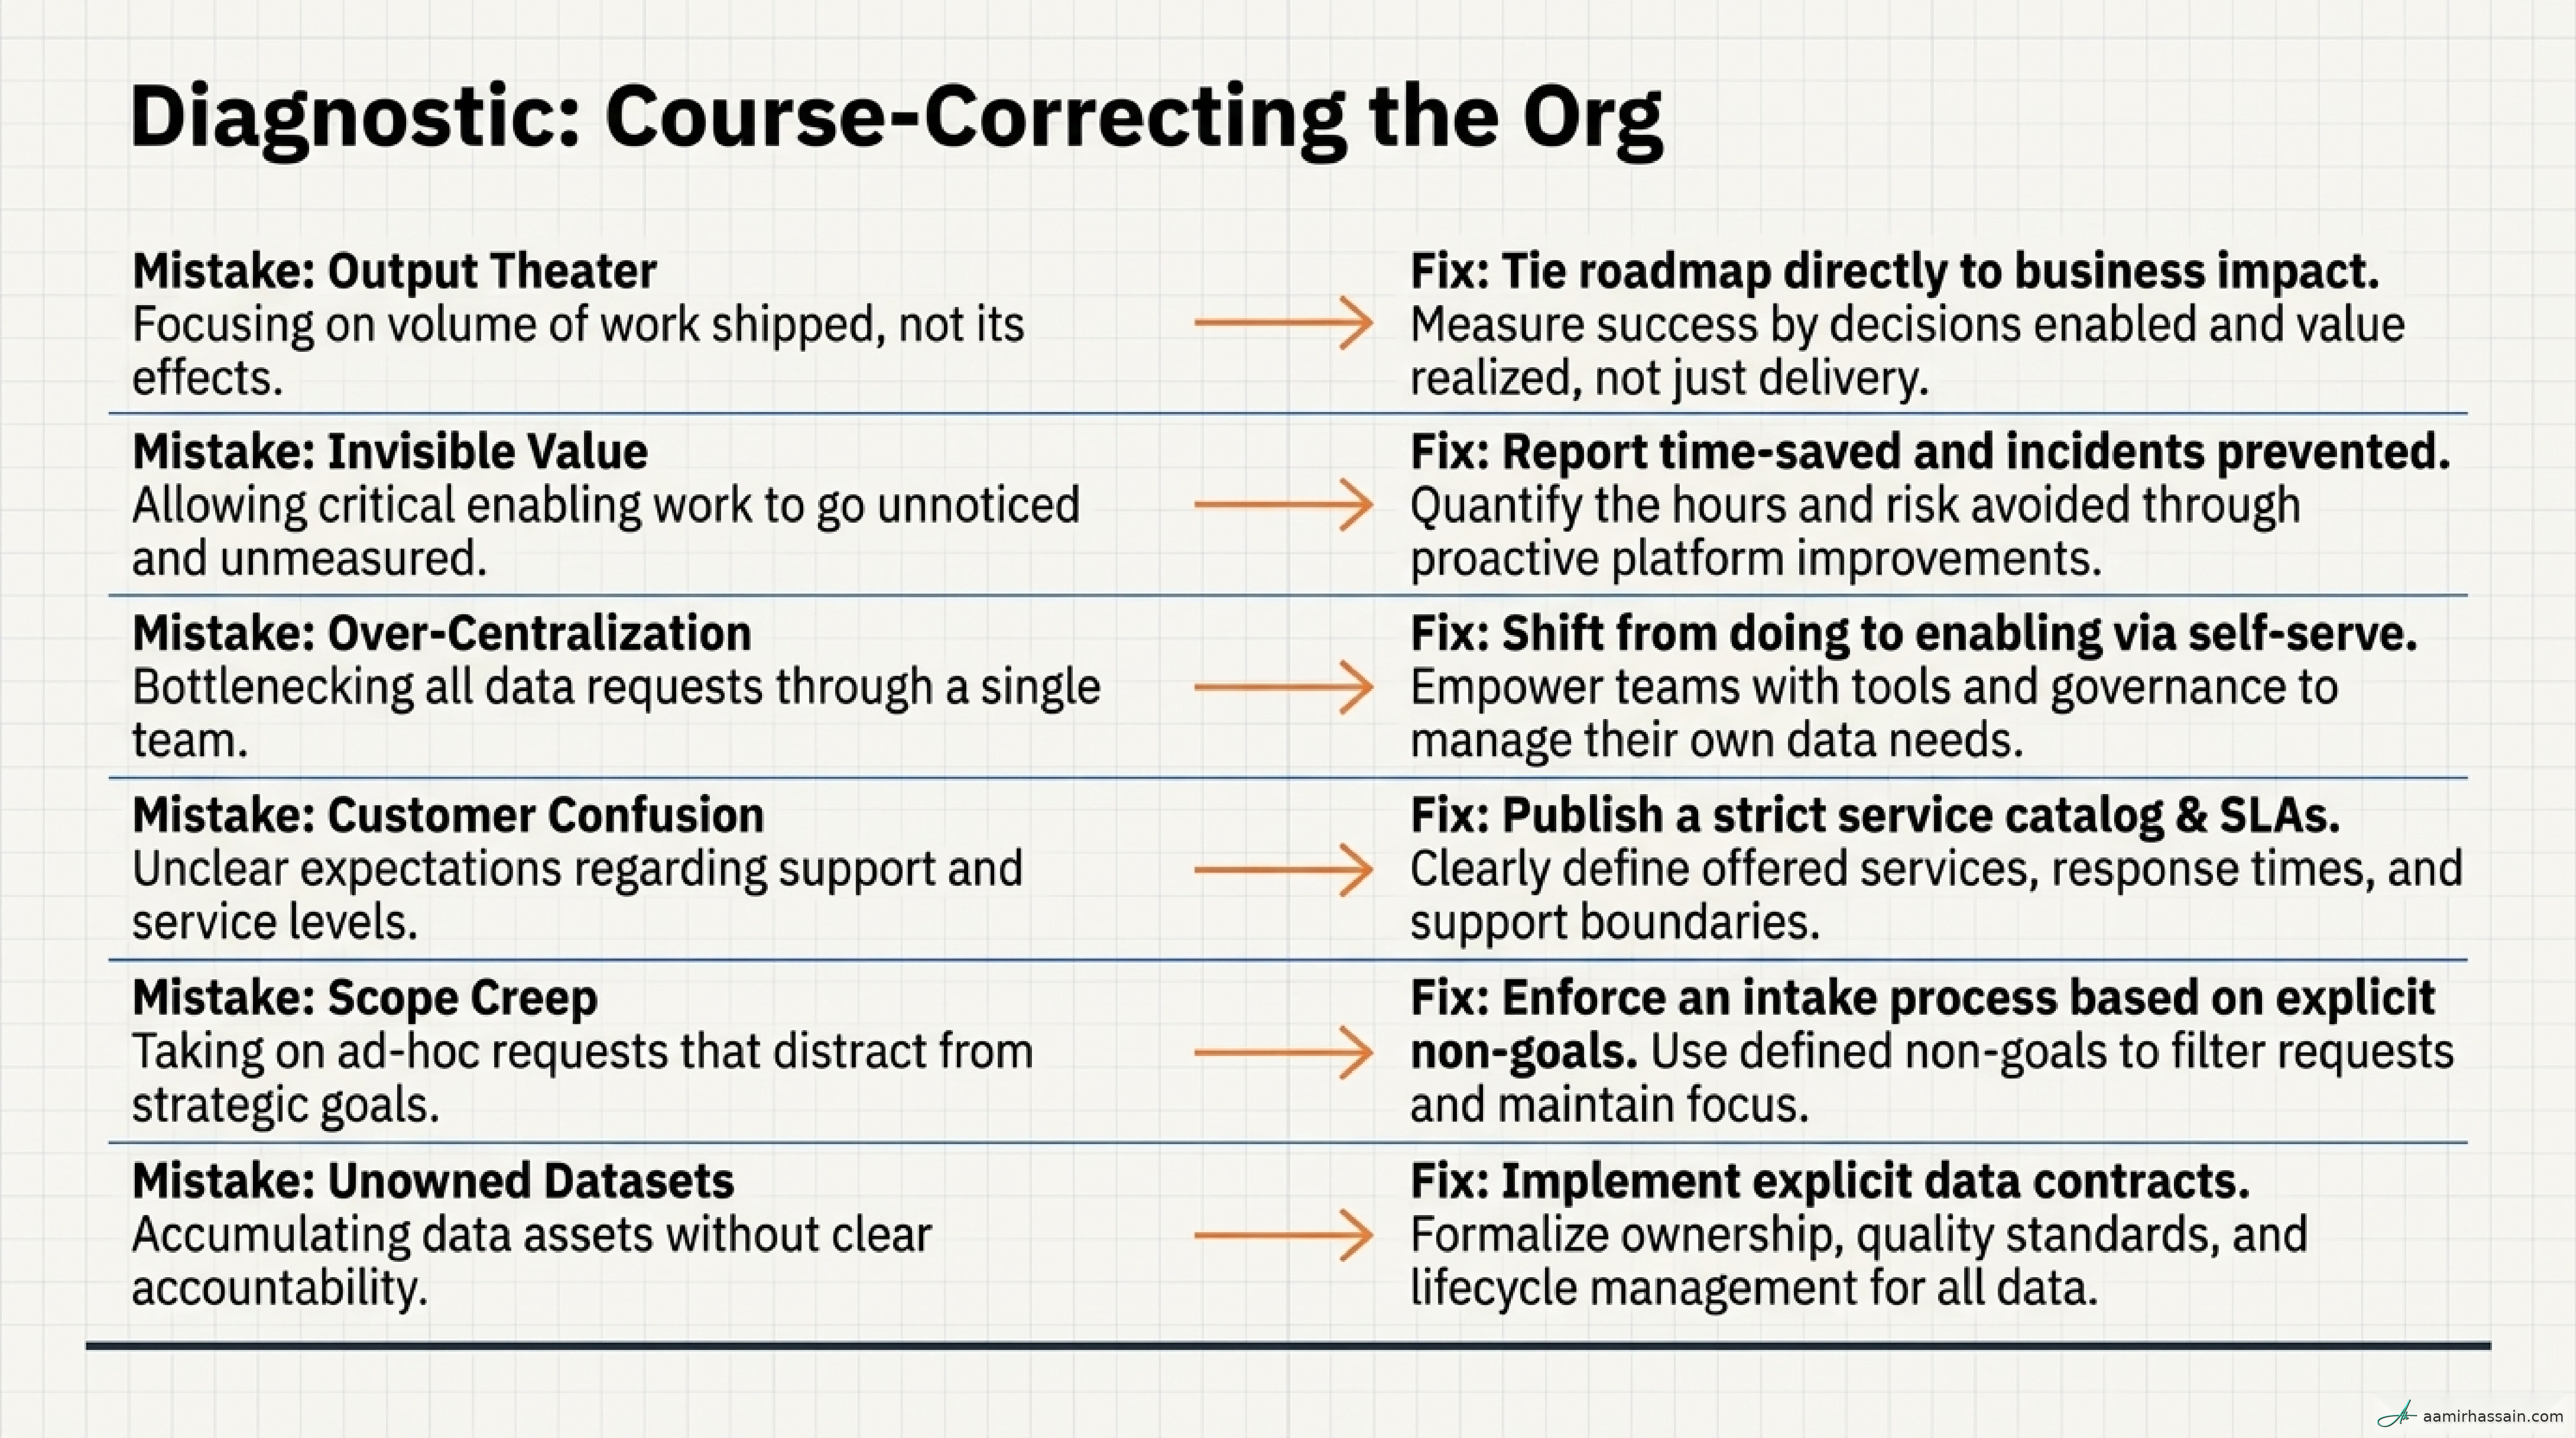
- Output theater: Measuring pipeline count instead of business value. Fix: Tie roadmap items to specific customer outcomes.
- Invisible value: Failing to report incidents prevented or costs avoided. Fix: Create regular stakeholder reporting that shows time saved and risk mitigated.
- Customer confusion: Not telling stakeholders what services are available. Fix: Publish a service catalog with capabilities, SLAs, and intake channels.
- Over-centralization: Attempting to own every transformation. Fix: Move from doing to enabling through platform capabilities and documentation.
- Standardizing too late: Letting every team build bespoke pipelines. Fix: Establish golden paths early for ingestion and orchestration.
- Ignoring non-goals: Accepting work such as ML modeling or dashboarding. Fix: Use the charter to protect focus and redirect work appropriately.
- Bespoke debt: Building custom code for every new source. Fix: Standardize ingestion frameworks so onboarding becomes configuration-driven rather than handcrafted.
Close + Next Steps#
The transformation from a ticket-taking team to a strategic platform organization requires a shift in focus from pipelines to outcomes. When you define your mission around speed, trust, and cost efficiency, you align your work with what leadership already cares about. You stop looking like a factory and start operating like a strategic function that helps the company act on signals faster.
Immediate Actions for the Next 30 Days#
- Identify your customers by listing the top three teams that depend on your data and interviewing them about their biggest frustrations.
- Draft a mission statement and turn it into a one-page charter that defines what you do, what you do not do, and how you measure success.
- Audit the backlog for requests that fall outside your non-goals and begin transitioning those responsibilities.
- Publish a service catalog so stakeholders know how to engage with the platform.
Finally, ask yourself: If your top five datasets lost their owner tomorrow, what would the cost to the business be by Friday? If you do not have a clear answer, you are carrying silent risk. That is the signal that it is time to build your charter and reclaim your team’s strategic value.