Quick glossary
- CDARL — Context, Decision, Action, Result, Learnings (the Impact Narrative pattern)
- SLA — Service Level Agreement
- ETL — Extract, Transform, Load
- DAGs — Directed Acyclic Graphs (workflow definitions in orchestration tools)
- GCP — Google Cloud Platform
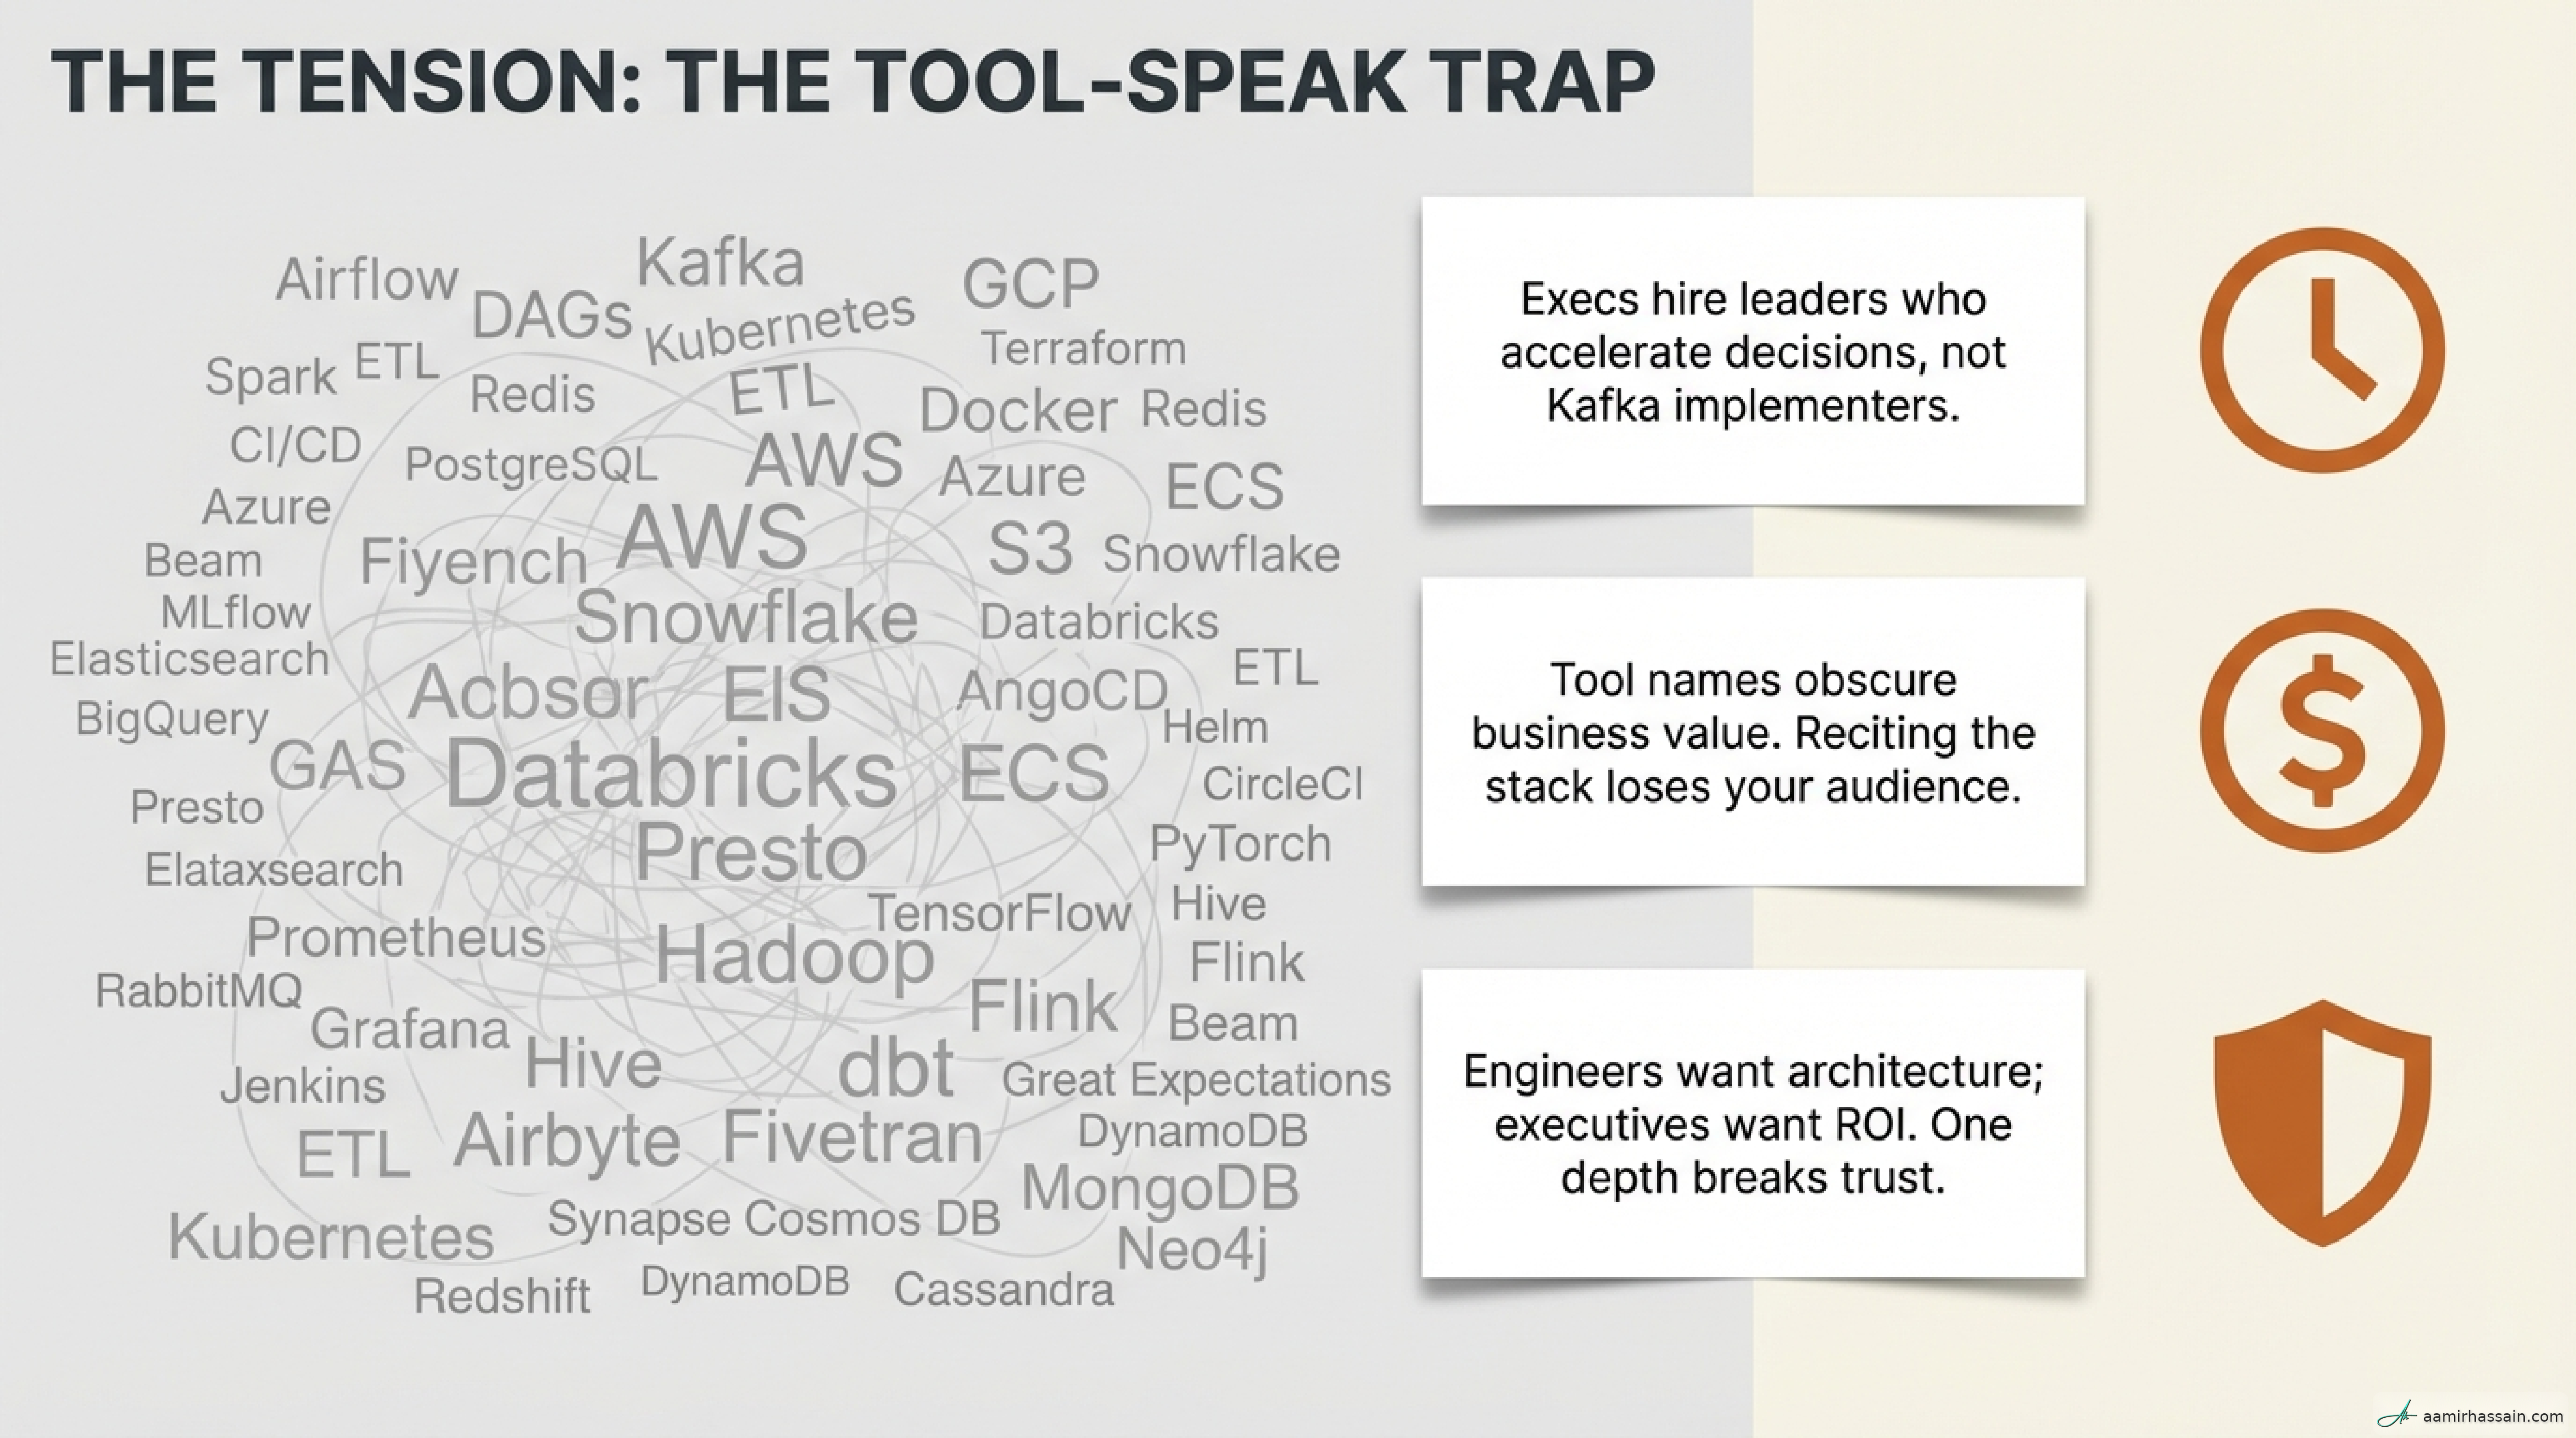
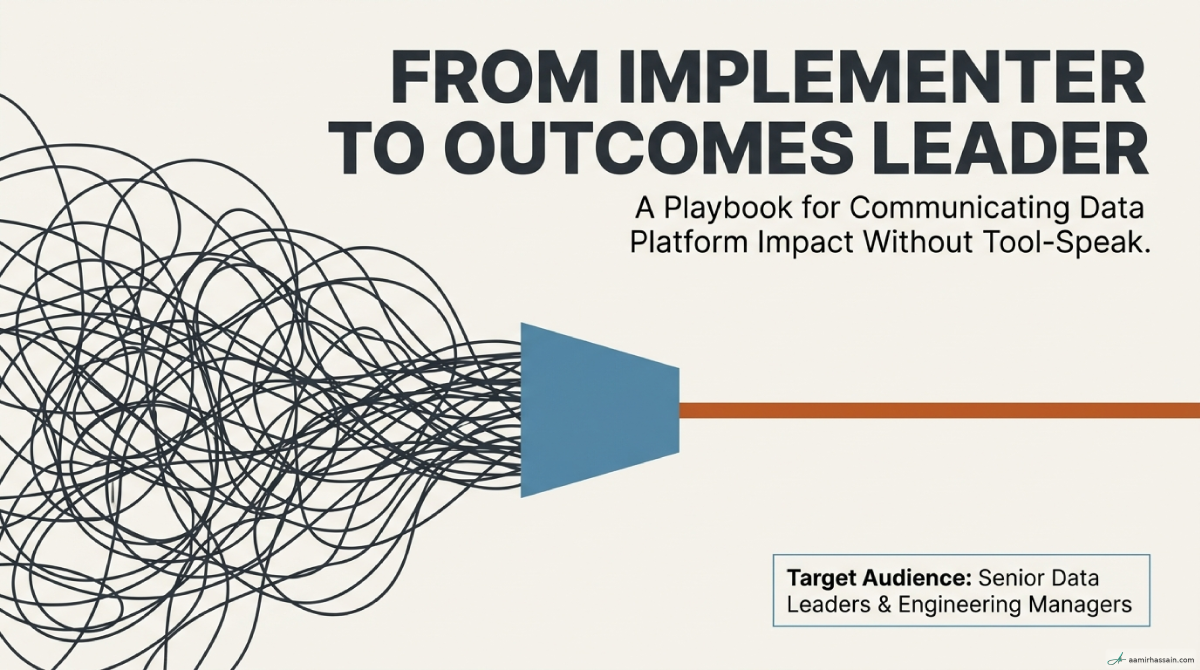
Technical leaders often fall into a common trap: they deliver massive infrastructure improvements that the business perceives as invisible, expensive overhead, or “just IT work.” This disconnect happens because engineering leaders describe their process rather than their product. To earn trust and secure investment, Data Engineering Managers and Platform Leads must shift from being technology implementers to becoming outcomes leaders.
When the business sees your platform as a cost center, your budget is a target. When they see it as an enablement engine, your budget is an investment. By mastering the framework in this article, you ensure your team’s work is recognized for the business value it creates, not just the tools it maintains.
Key Takeaways#
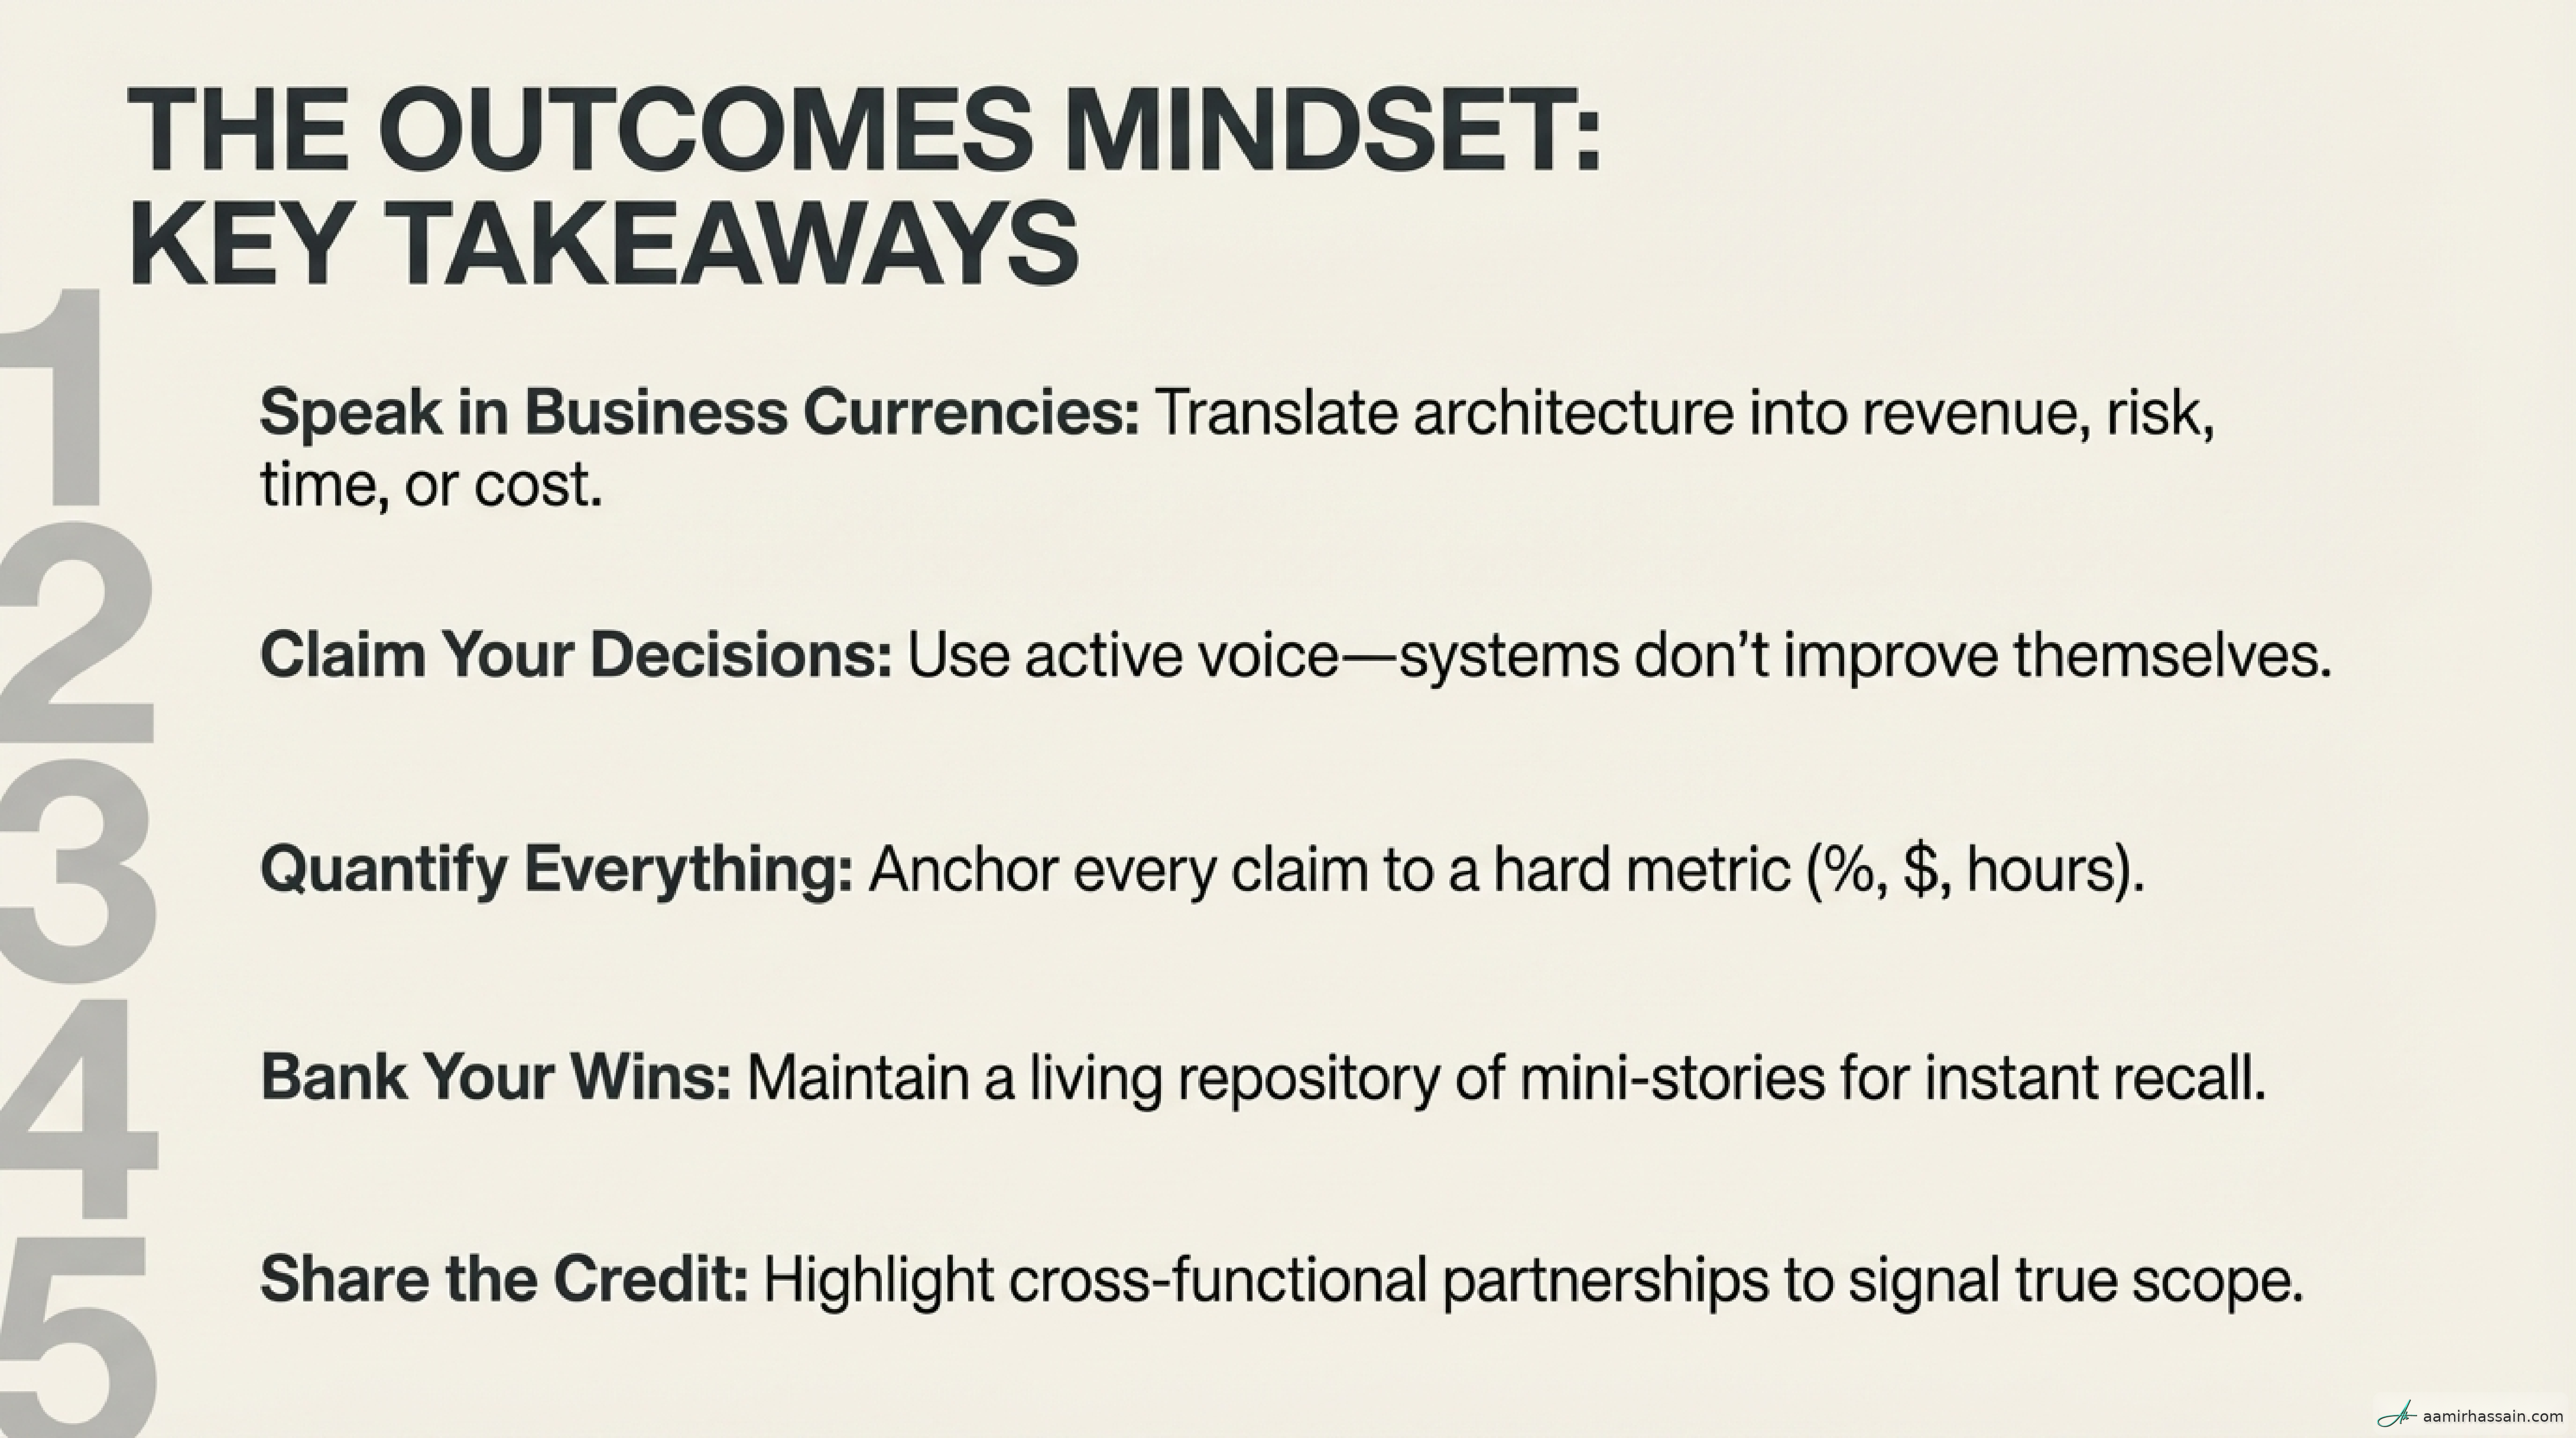
- Stop leading with tool names: Reframe every technical win as a solution to a specific business problem.
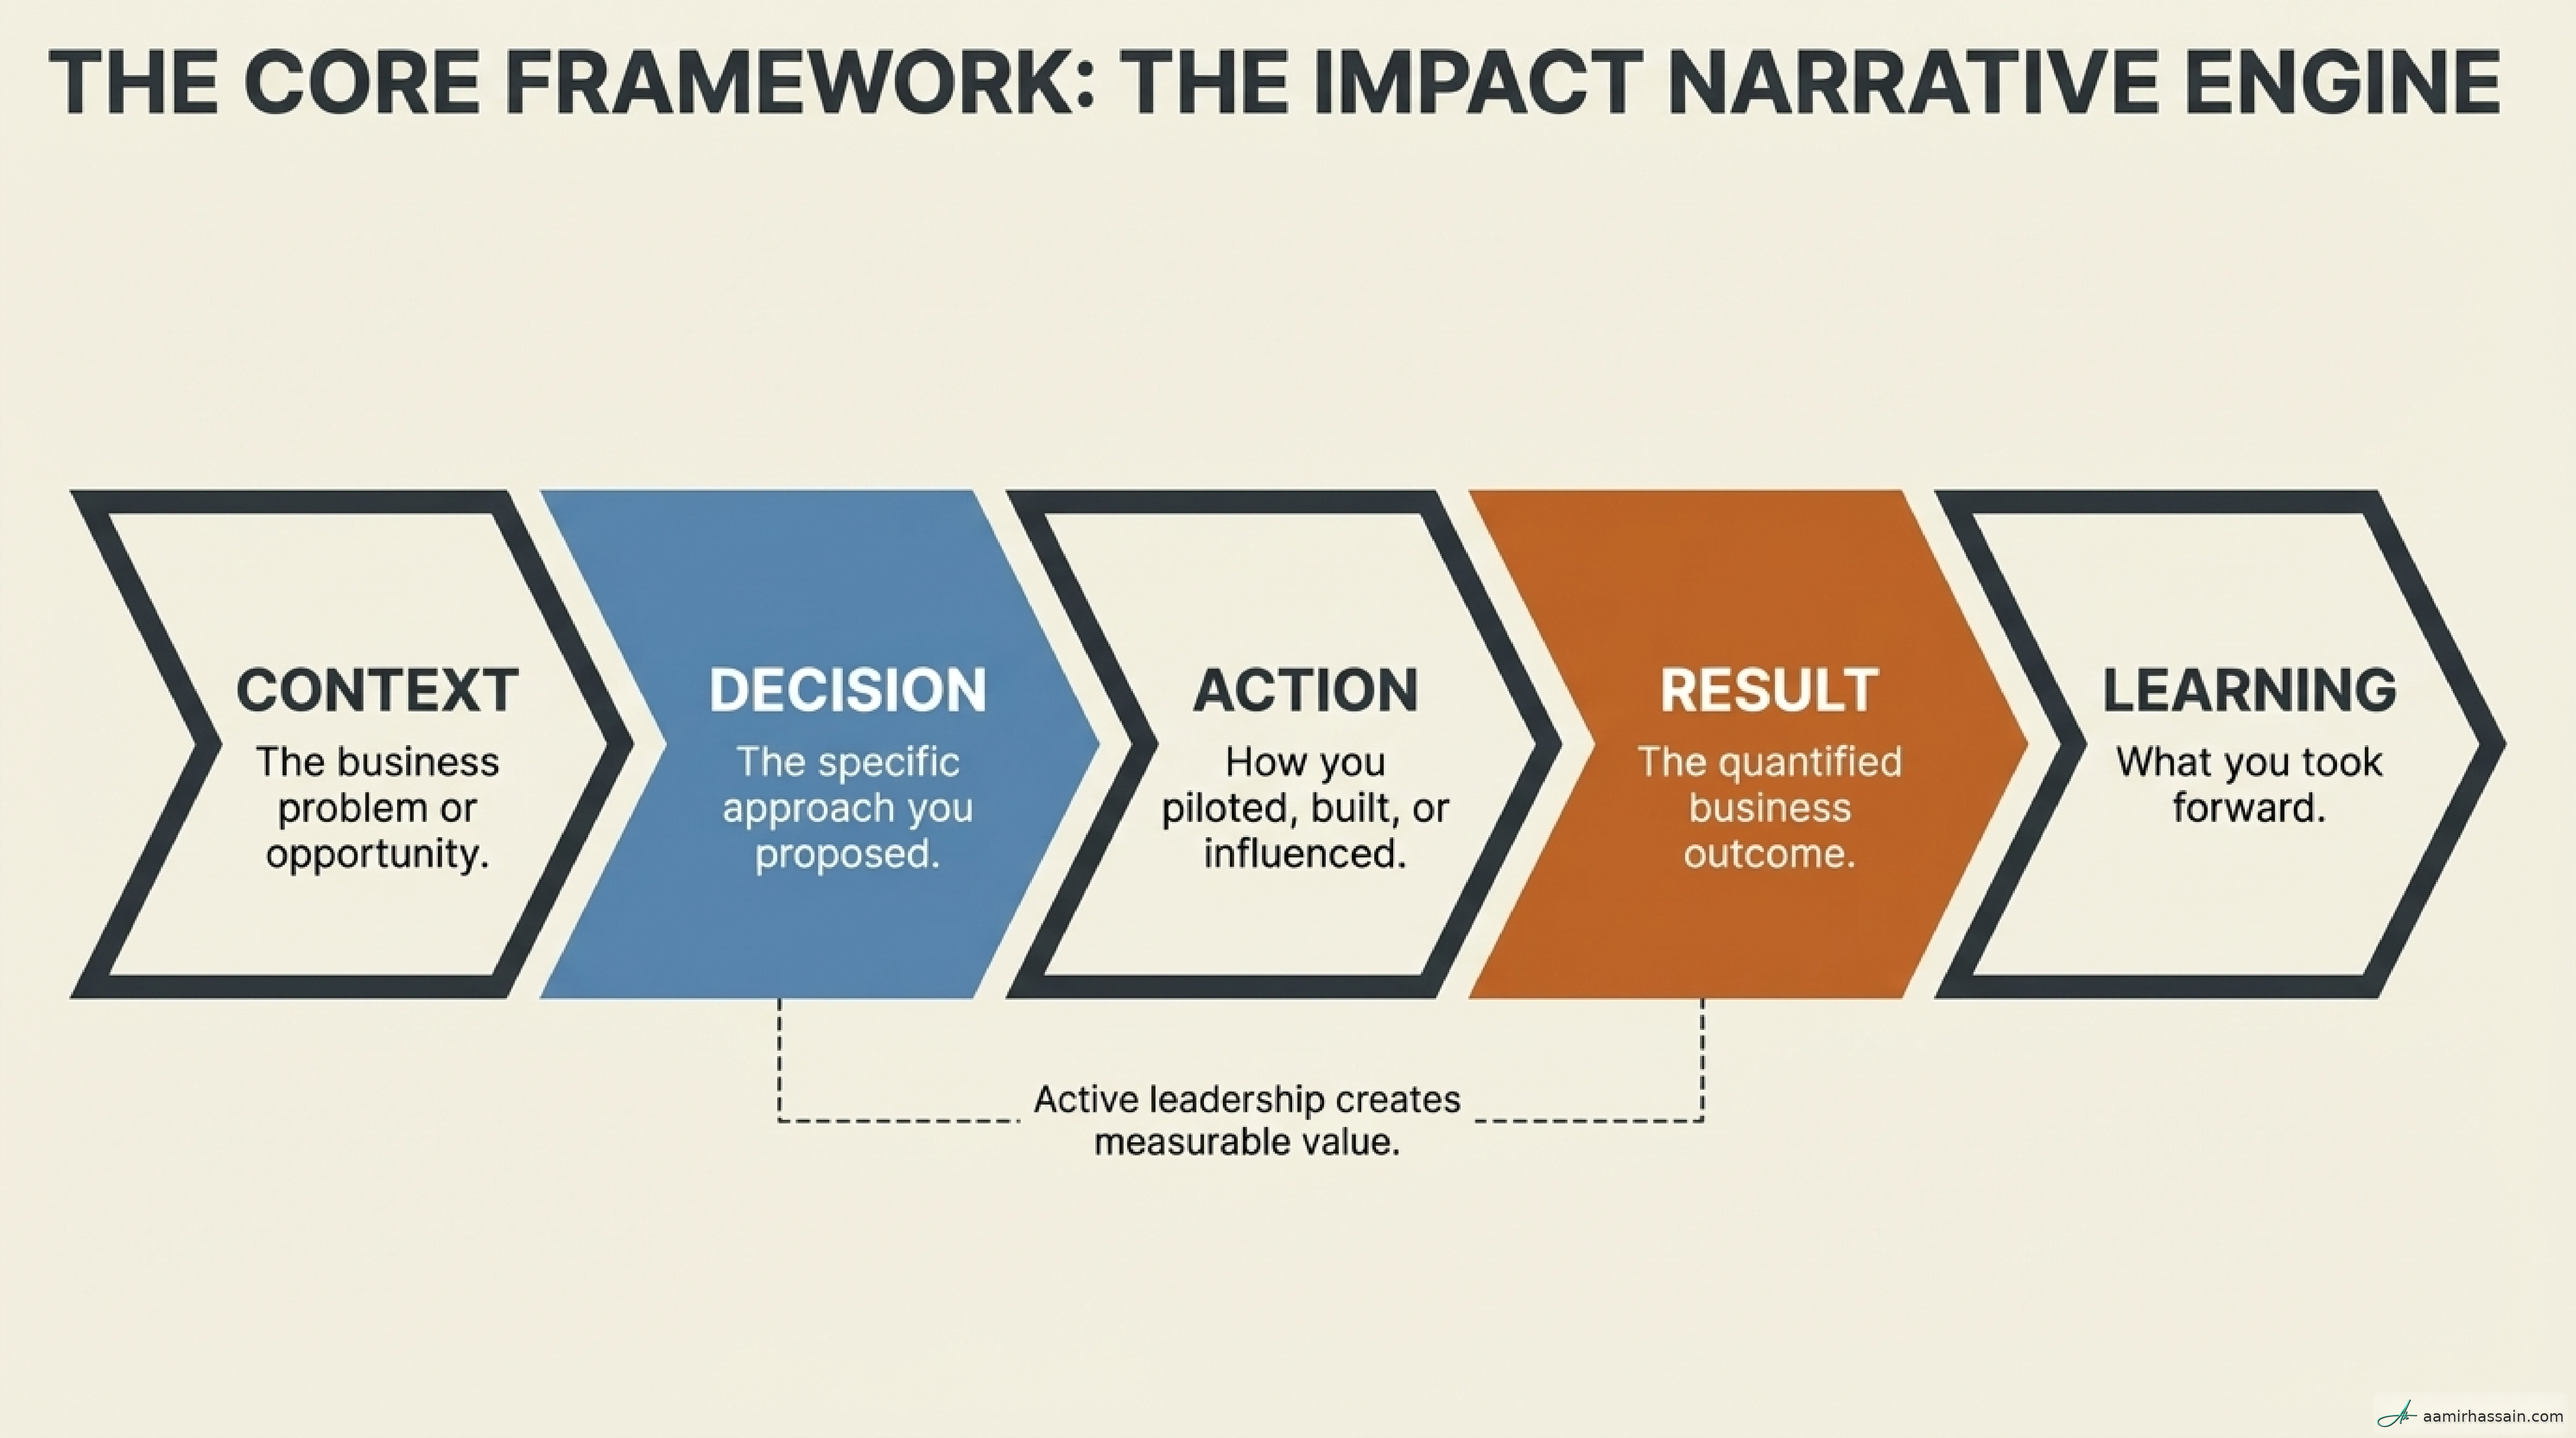
- Master the Impact Narrative Pattern: Structure every communication using Context → Decision → Action → Result → Learnings.
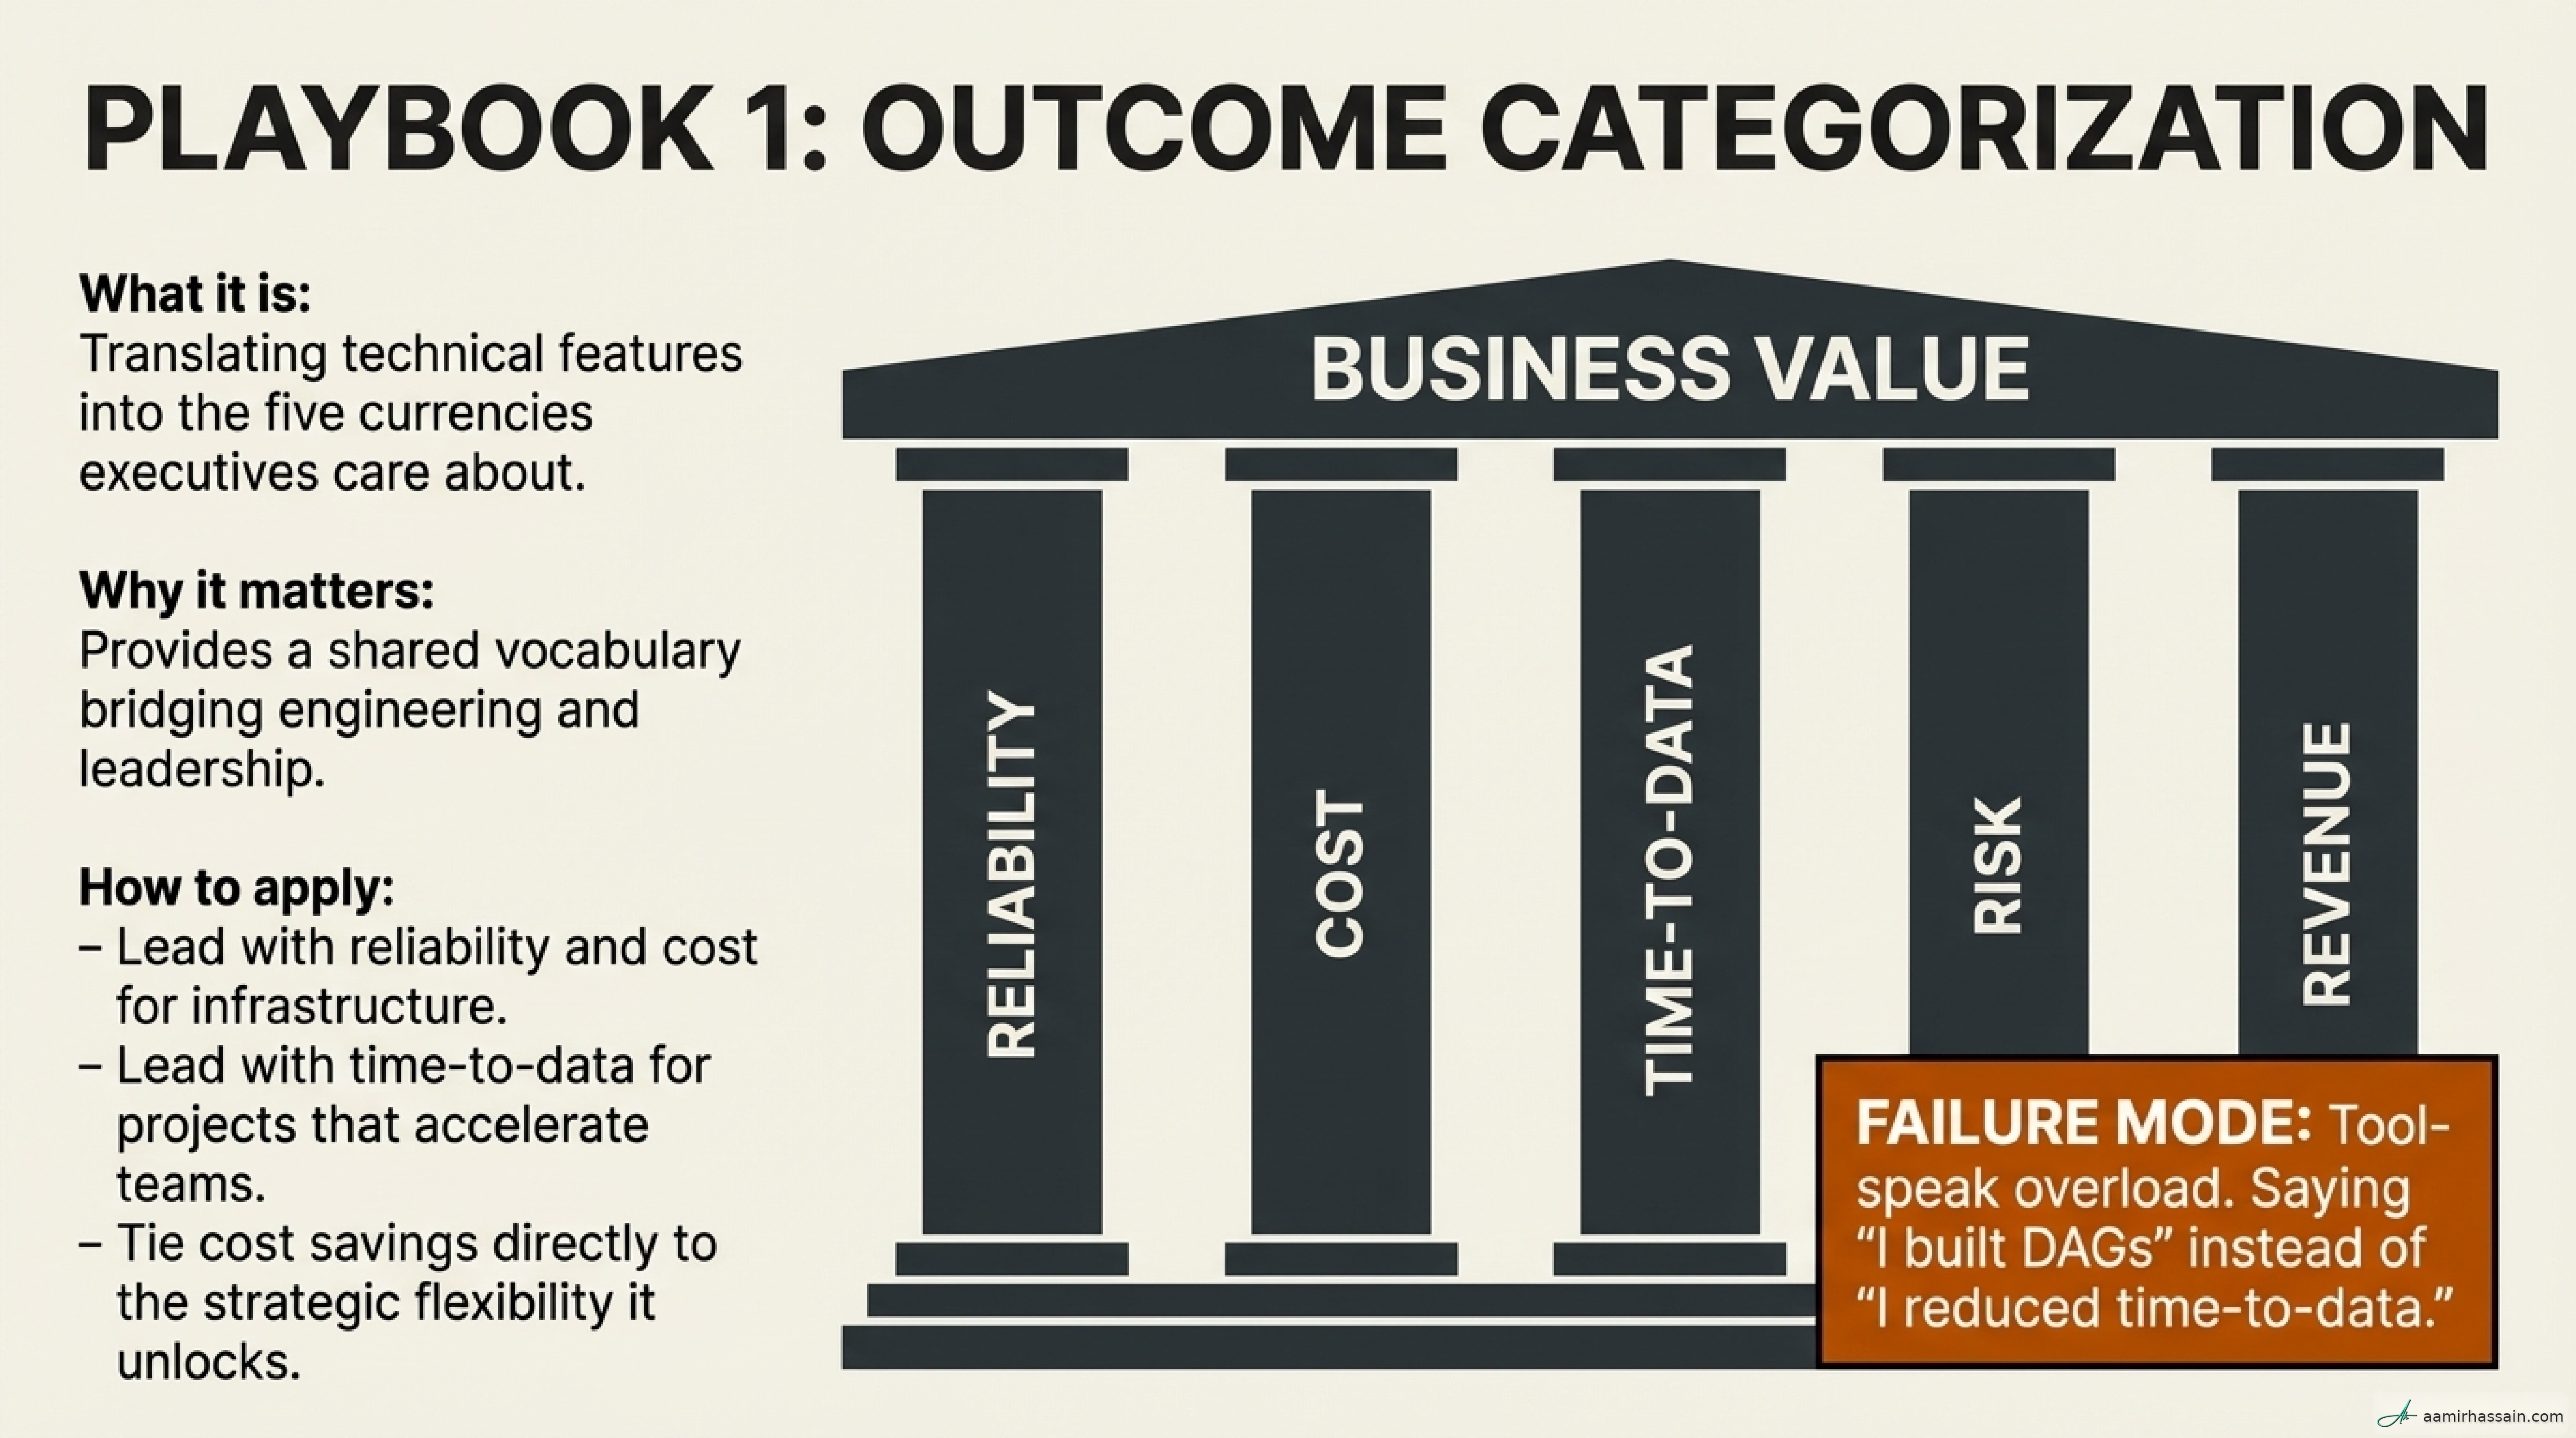
- Categorize for Clarity: Align every project with one of five core value categories: Reliability, Cost, Time-to-Data, Risk, or Revenue.
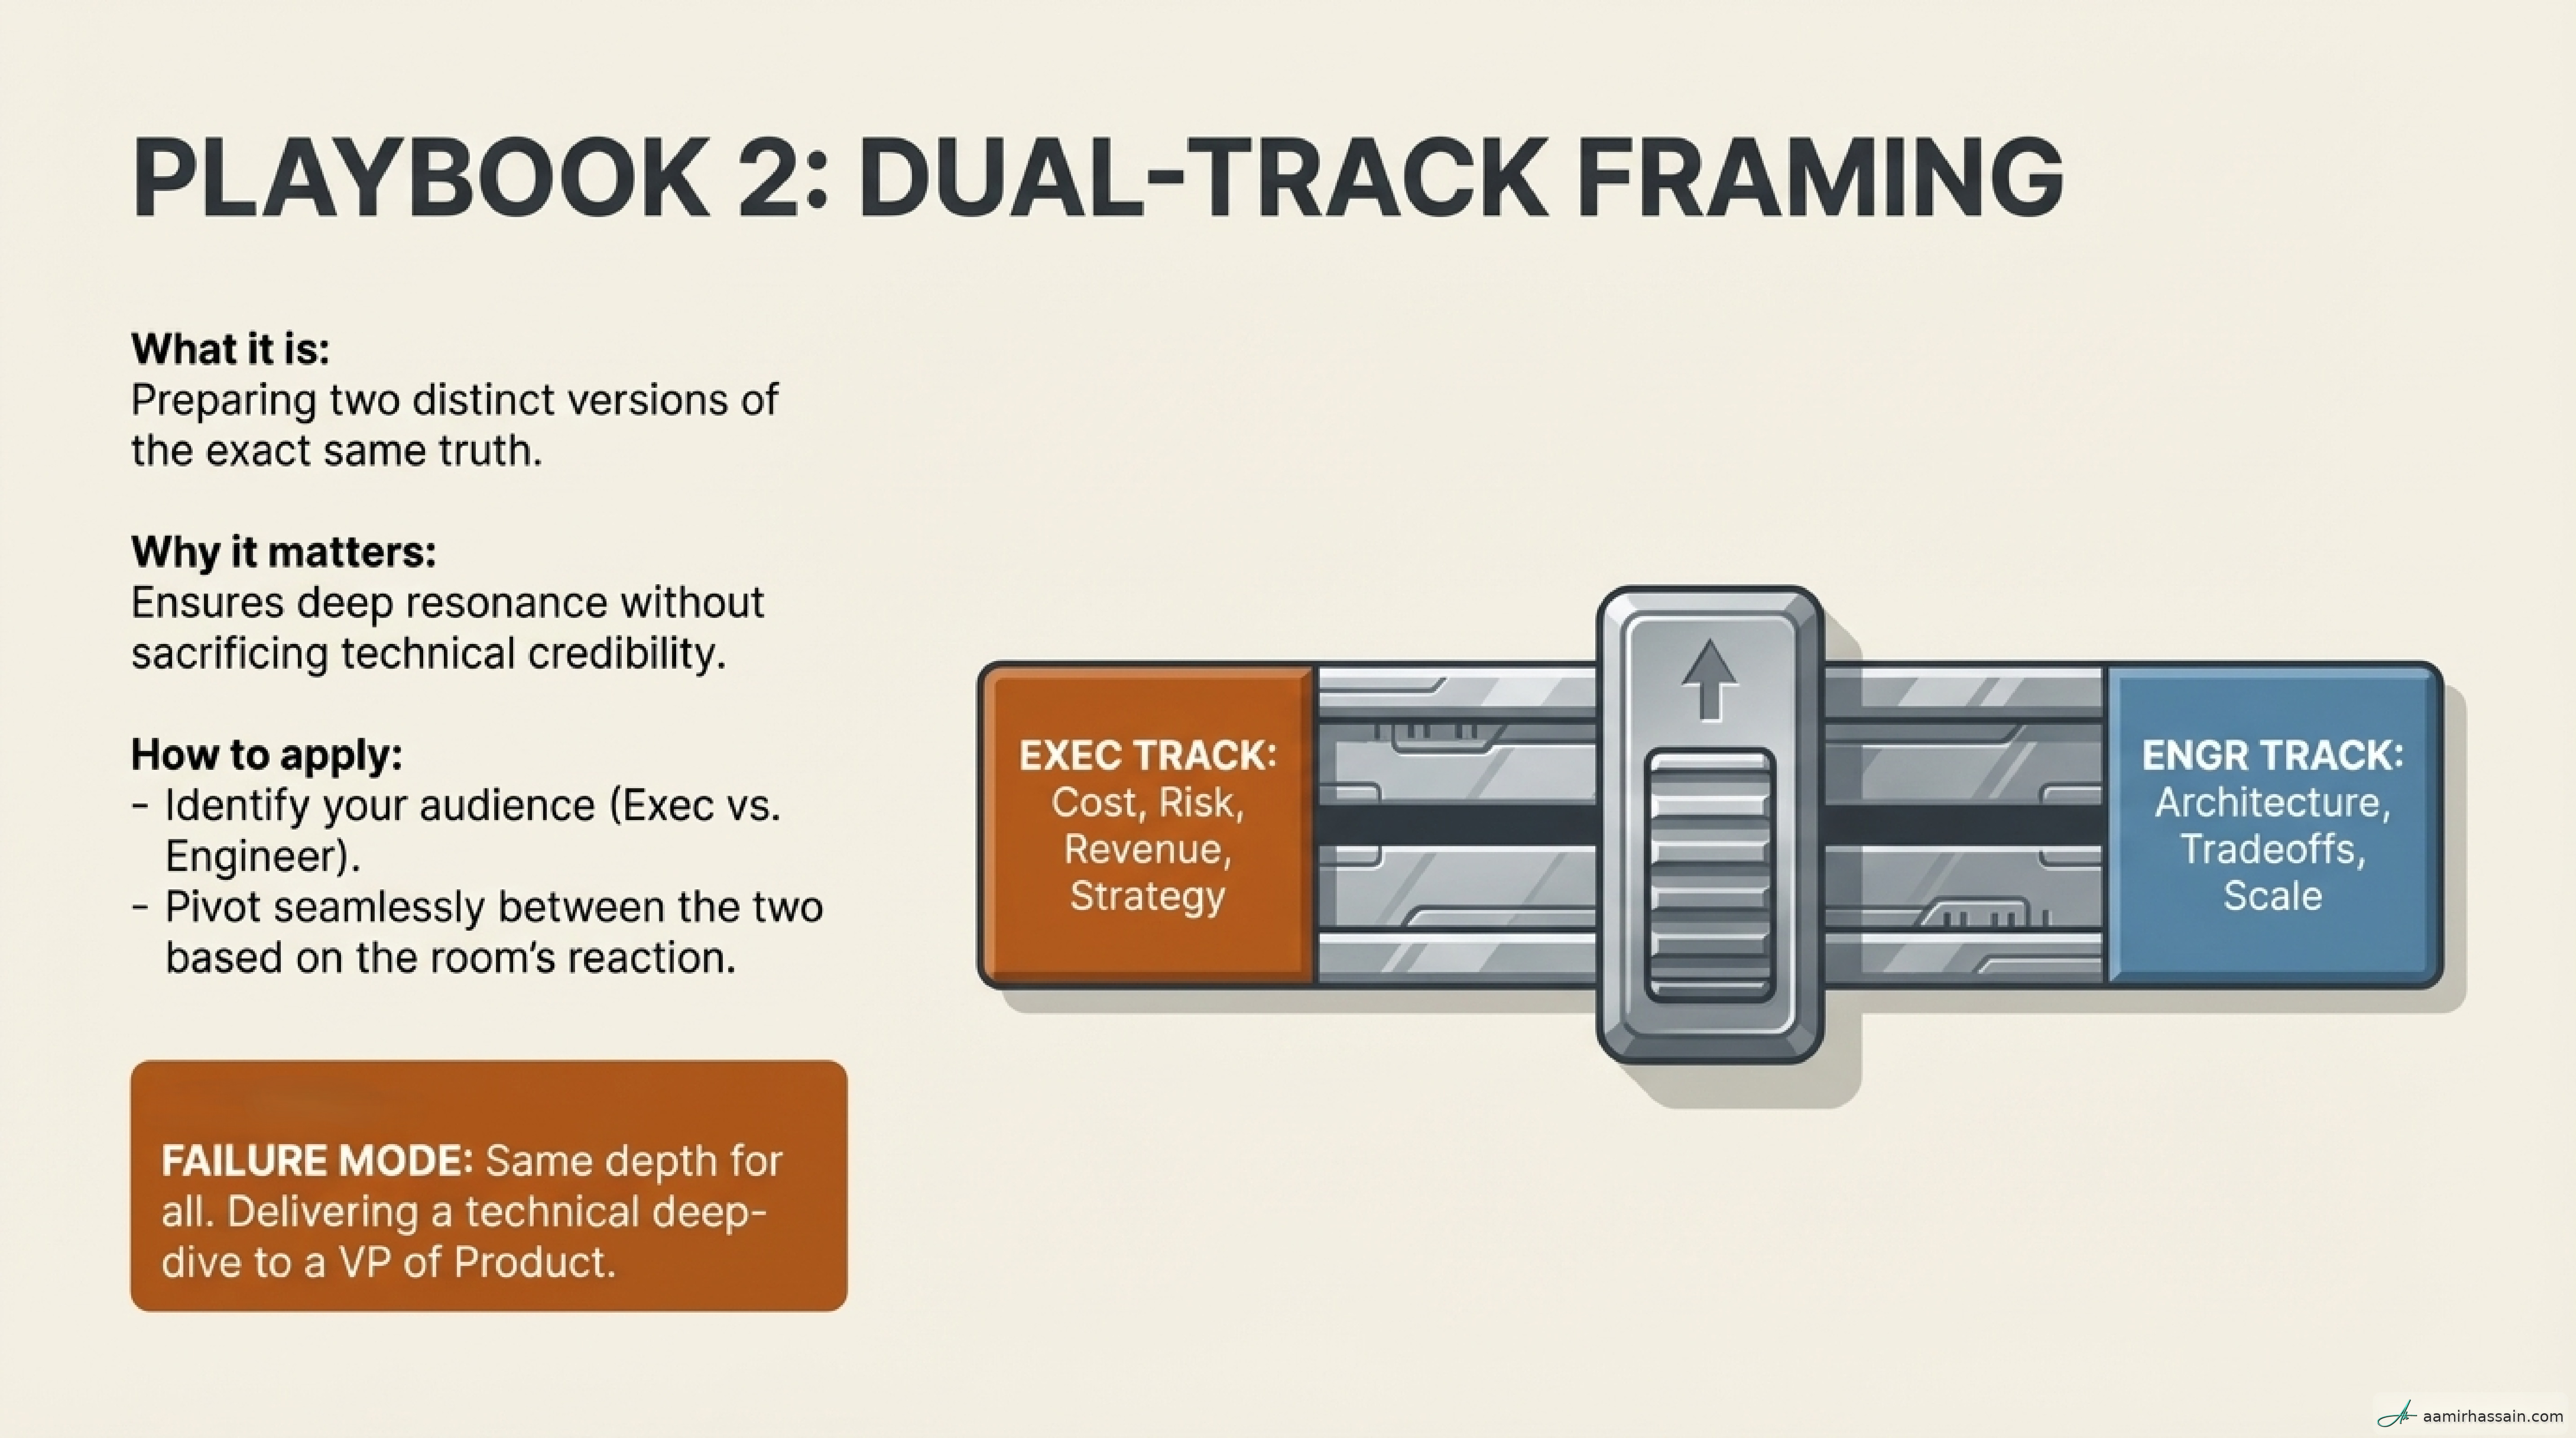
- Target the Audience: Prepare distinct “Exec” and “Engineer” versions of the same truth to maximize resonance.
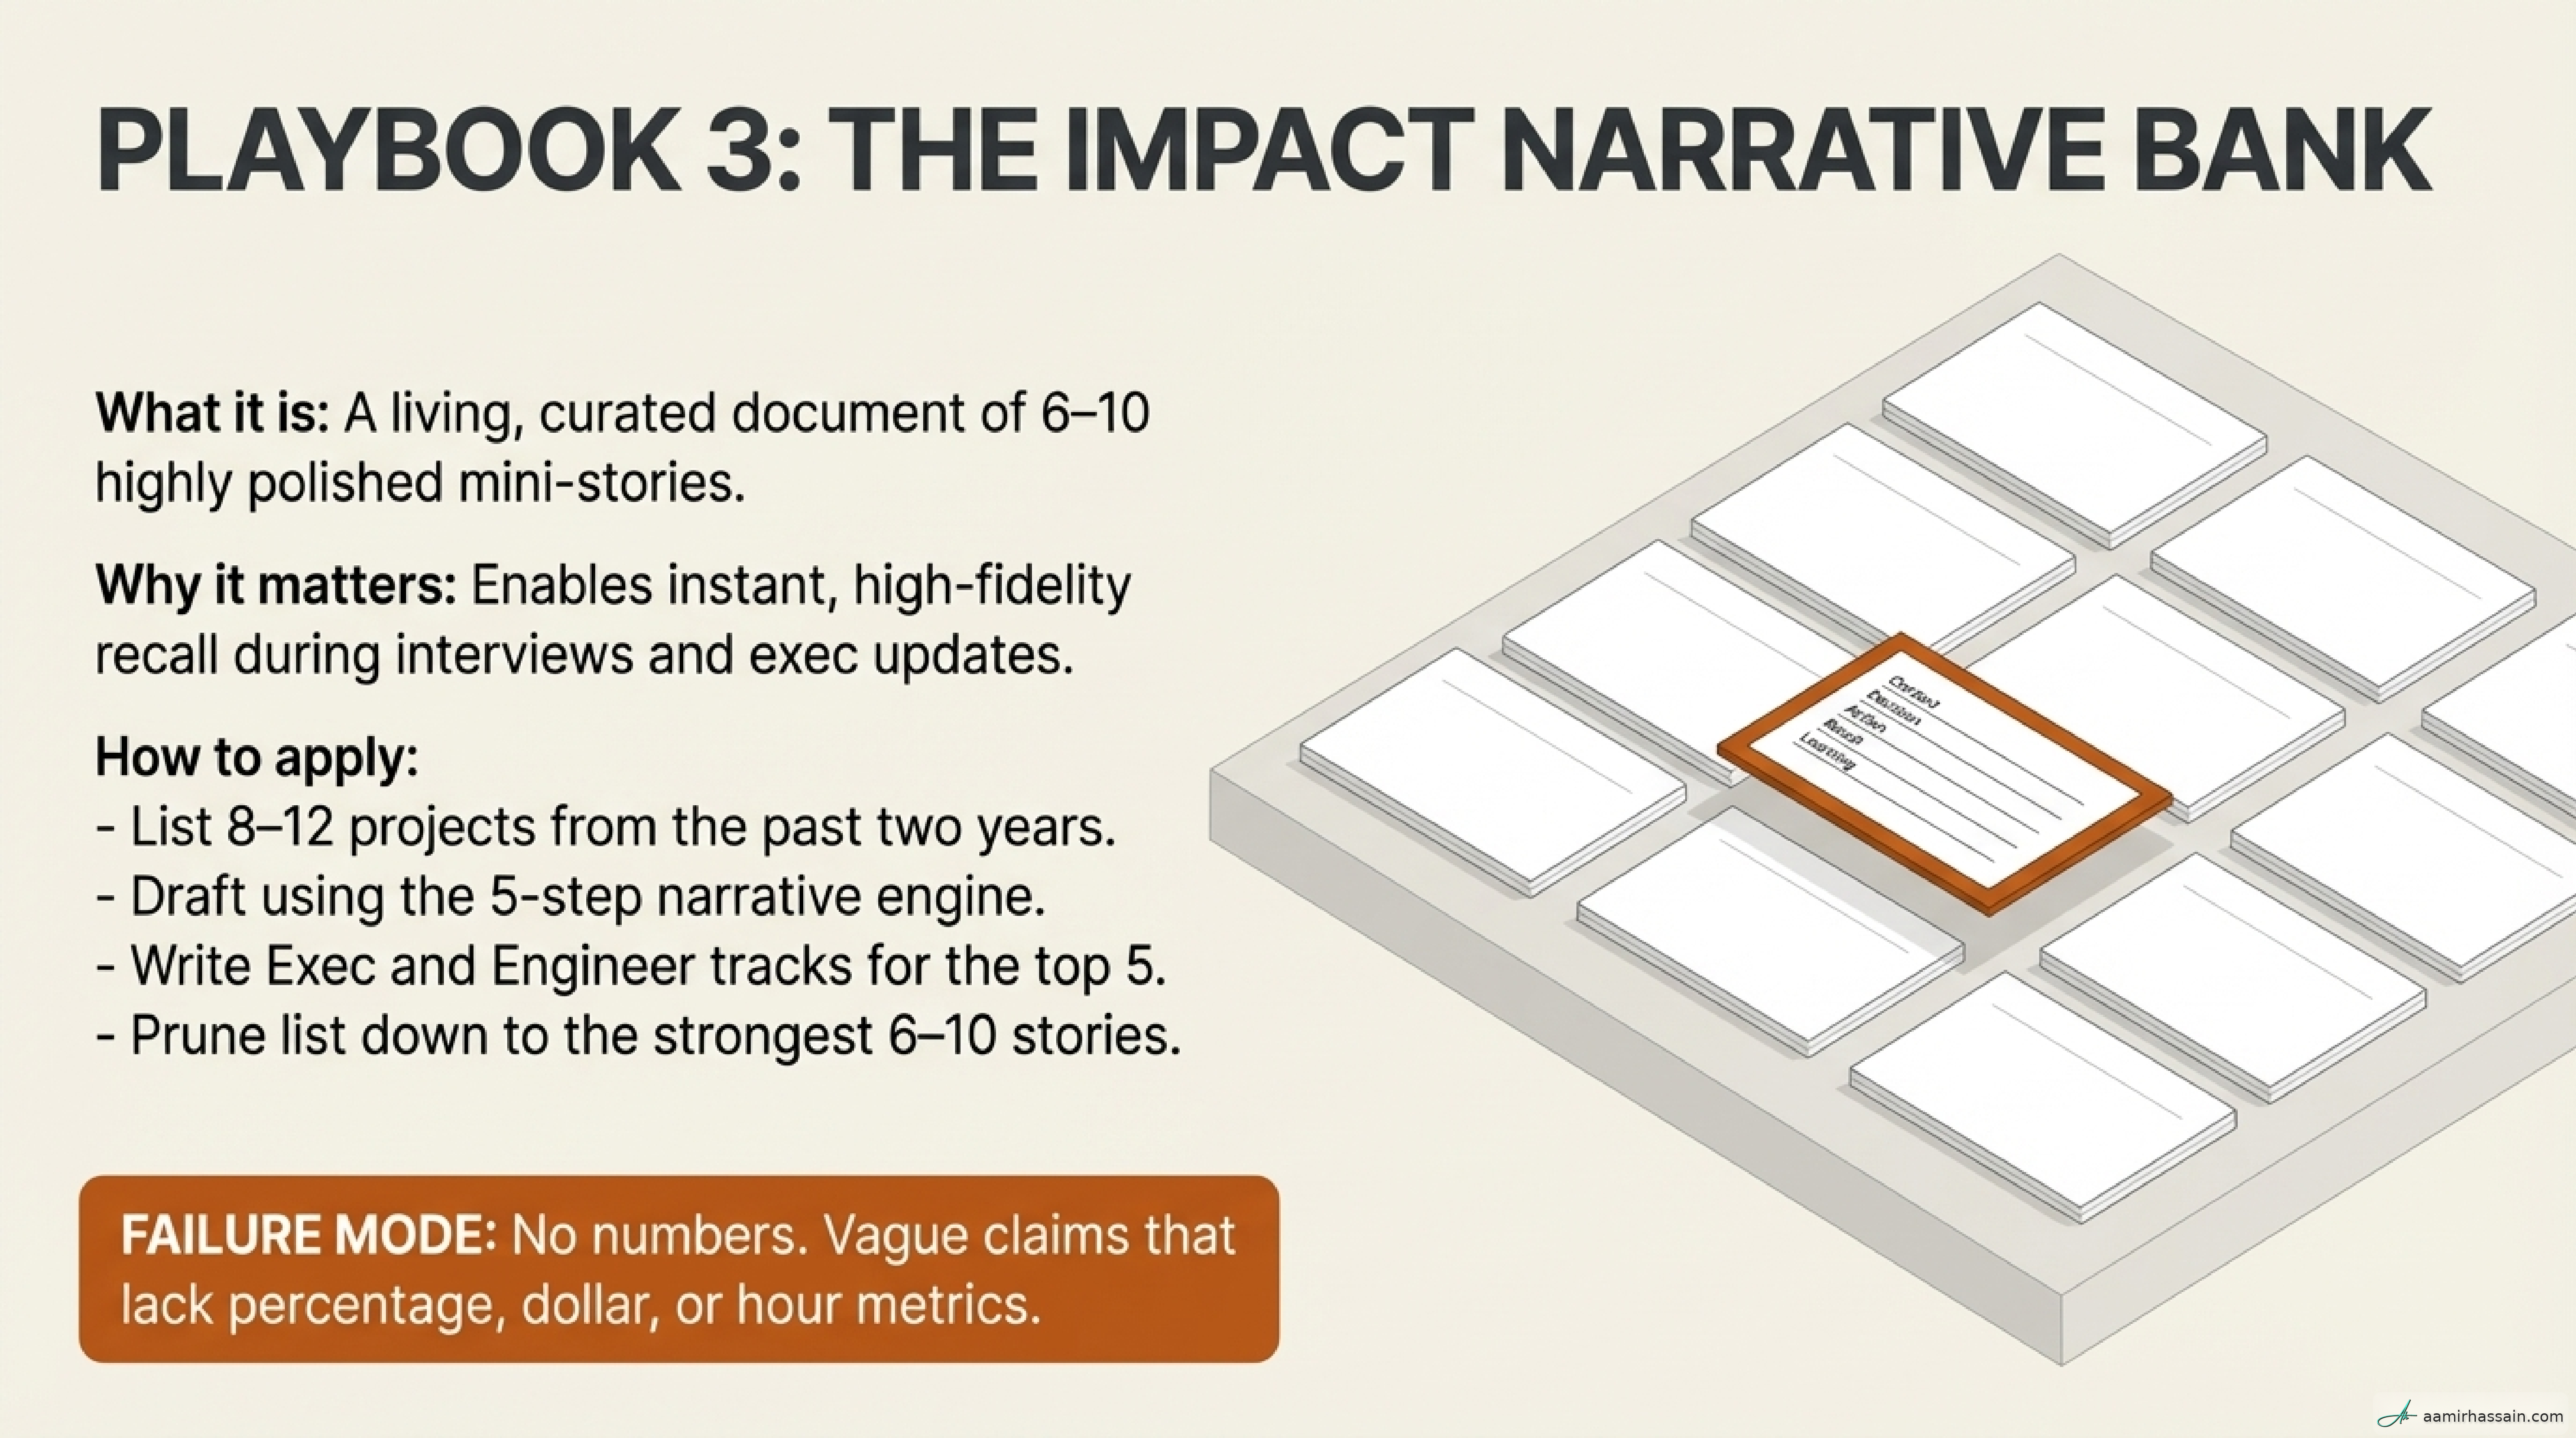
- Build an Impact Bank: Maintain a career “war chest” of quantified mini-stories for instant recall in reviews or interviews.
- Quantify the Intangible: Never present a result without a metric (%, $, hours, or incidents), especially when quantifying avoided risk.
The Core Model: The Impact Narrative#
The “Impact Narrative” is a structured communication pattern designed to bridge the gap between technical execution and business strategy. It moves the conversation from what you did to what you decided and what it achieved.
The CDARL Pattern#
- Context: The specific business problem or opportunity (e.g., “Marketing couldn’t act on data fast enough”).
- Decision: The pivot point of leadership. State the choice you made or the proposal you led—using active voice to demonstrate ownership.
- Action: The concrete steps you and your team took to execute the decision.
- Measurable Result: The outcome quantified by a business metric (%, $, or time).
- Learnings: A strong-signal callout that demonstrates a growth mindset and self-awareness regarding tradeoffs or future improvements.
Five Core Outcome Categories#
Resonate with stakeholders by bucketing projects into these business-aligned categories:
- Reliability: Trust in systems, SLA attainment, and incident reduction.
- Cost Reduction: Lowering compute spend ($/query) and infrastructure overhead to create strategic flexibility.
- Time-to-Data: Reducing the latency between an event occurring and data being usable for decisions.
- Risk Mitigation: Ensuring security, compliance, and operational stability.
- Revenue Enablement: Unlocking data that directly powers products or customer experiences.
The “Exec vs. Engineer” Framing#
A leader must speak two languages. While the technical truth remains the same, the emphasis shifts based on the audience:
- Executive Framing: Emphasizes business value, cost, risk, and strategic alignment.
- Engineer Framing: Emphasizes technical depth, architecture, tradeoffs, and scalability.
The narrative shift in practice:
- Tool-Speak (Avoid): “I implemented Airflow DAGs in GCP.”
- Outcome-Framed (Use): “I reduced time-to-data from 3 days to 4 hours, enabling same-day campaign optimization for Marketing.”
The Practical Playbook: Mastering Outcome Framing#
Reliability and Operability#
Reliability is about building and maintaining business trust in your data systems. It ensures business continuity and prevents downstream decision-making failures that erode stakeholder confidence.
How to implement:
- Partner with Finance to calculate the hourly revenue loss of a system outage to establish a baseline for ROI.
- Map technical incidents to specific stakeholder pain points (e.g., “The CEO’s dashboard was blank during the board meeting”).
- Quantify the reduction in incident rates after a specific architectural decision.
- Focus on “trust” as a primary business asset that enables faster organizational movement.
- Use active voice to describe how you led the stability initiative.
What good looks like: Stakeholders no longer question data accuracy before making a move. The team spends more time on strategy and less on firefighting.
Common failure modes: Leading with the technical patch instead of the risk that was avoided. Failing to quantify how many hours of engineer focus time were recovered for high-value projects.
Cost and Complexity Optimization#
This category focuses on financial stewardship and the efficient use of resources. Optimization creates strategic flexibility by freeing up budget and compute resources for new, high-growth initiatives.
How to implement:
- Calculate savings in $/month or total compute hours and present them as a percentage of the total budget.
- Identify “dead” infrastructure that was decommissioned as a result of your decision.
- Tie cost savings to value explicitly: “We saved $X/month, which funded our new AI initiative.”
- Highlight the reduction in unit costs ($/query or $/GB processed) to show scalability.
- Demonstrate how reducing technical complexity simplified the developer experience and improved velocity.
What good looks like: Infrastructure spend grows significantly slower than the volume of data processed. Finance teams view the data platform as an efficient asset rather than a “black hole.”
Common failure modes: Presenting cost savings in a vacuum without tying them to the value those savings unlocked. Failing to show the “before and after” of infrastructure spend.
Time-to-Data and Enablement#
Enablement is about the speed at which the organization can turn data into action. Faster data leads to faster decisions, providing a competitive advantage in volatile markets.
How to implement:
- Measure the latency reduction from event occurrence to dashboard availability.
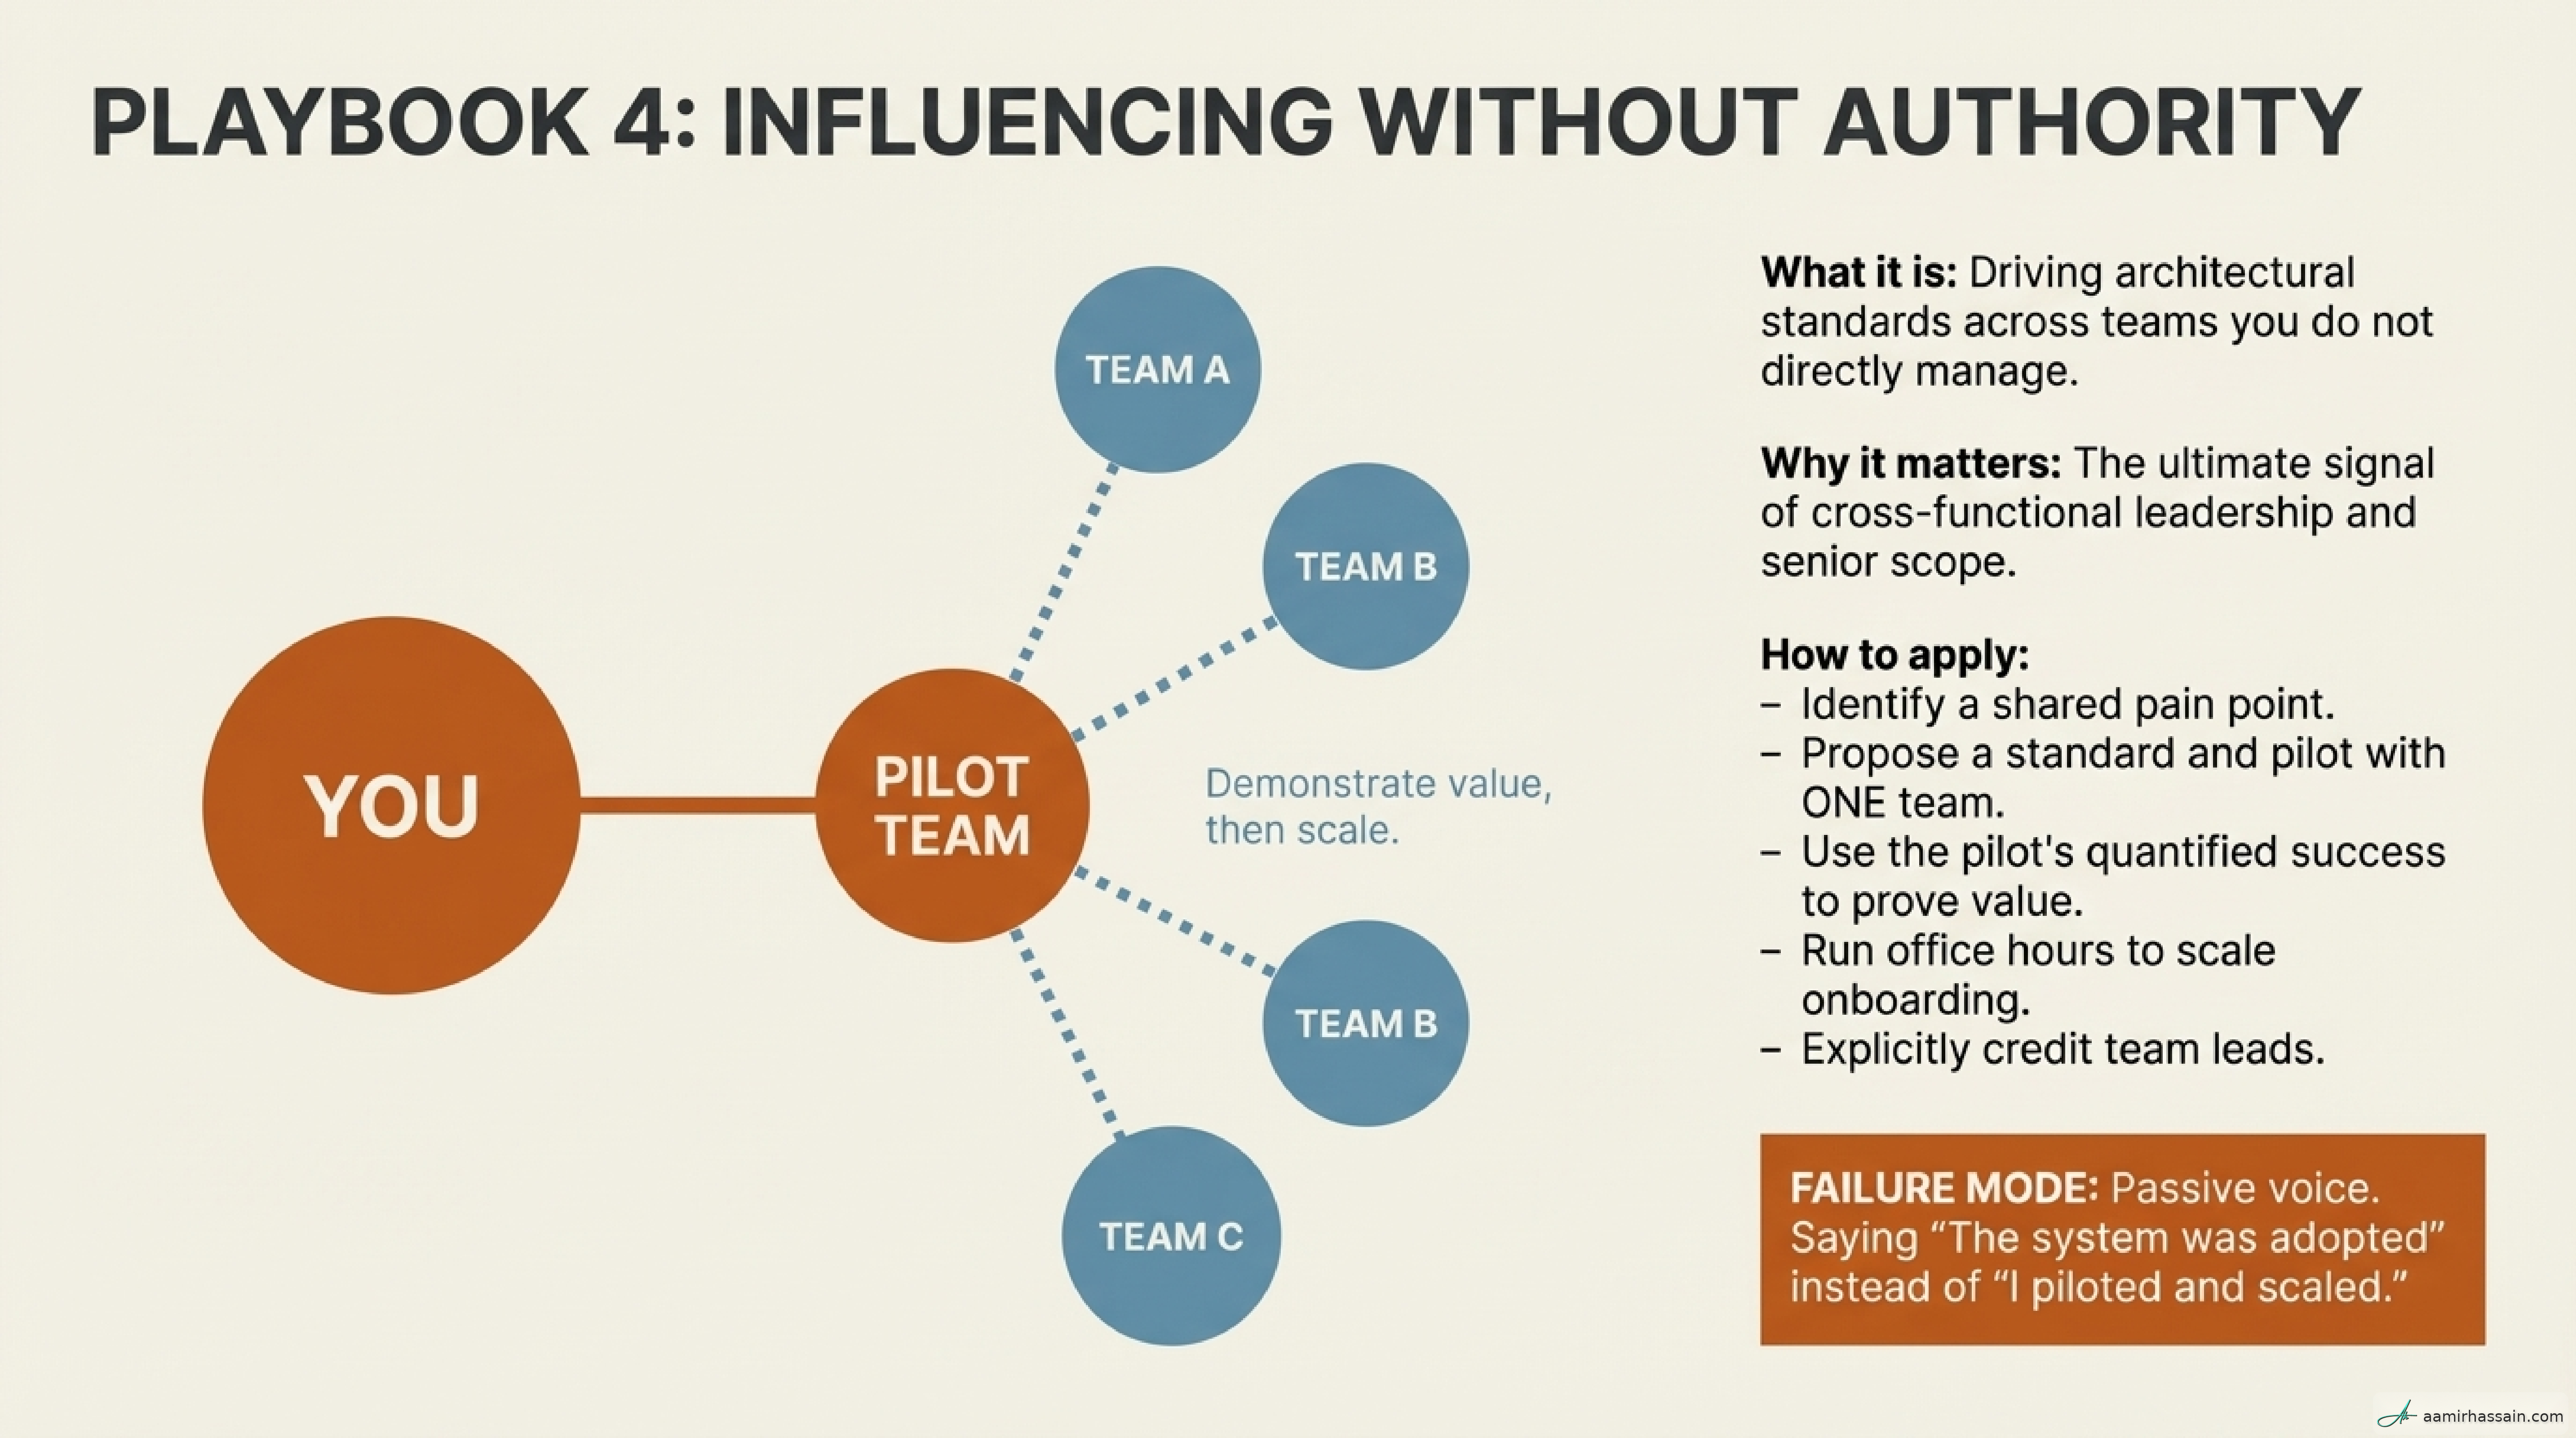
- Influence without authority: pilot success with one team to demonstrate value, then scale adoption across the org.
- Quantify the reduction in manual engineering hours required for new data ingestion.
- Document the adoption rate of new self-service tools among non-technical stakeholders.
- Highlight specific business decisions that were accelerated by the new architecture.
What good looks like: Non-technical teams access required data through self-service without filing engineering tickets. New data products move from conception to launch in days rather than weeks.
Common failure modes: Focusing on the “volume” of data moved instead of the “speed” of the decision-making it enabled. Ignoring qualitative feedback from stakeholders about their improved productivity.
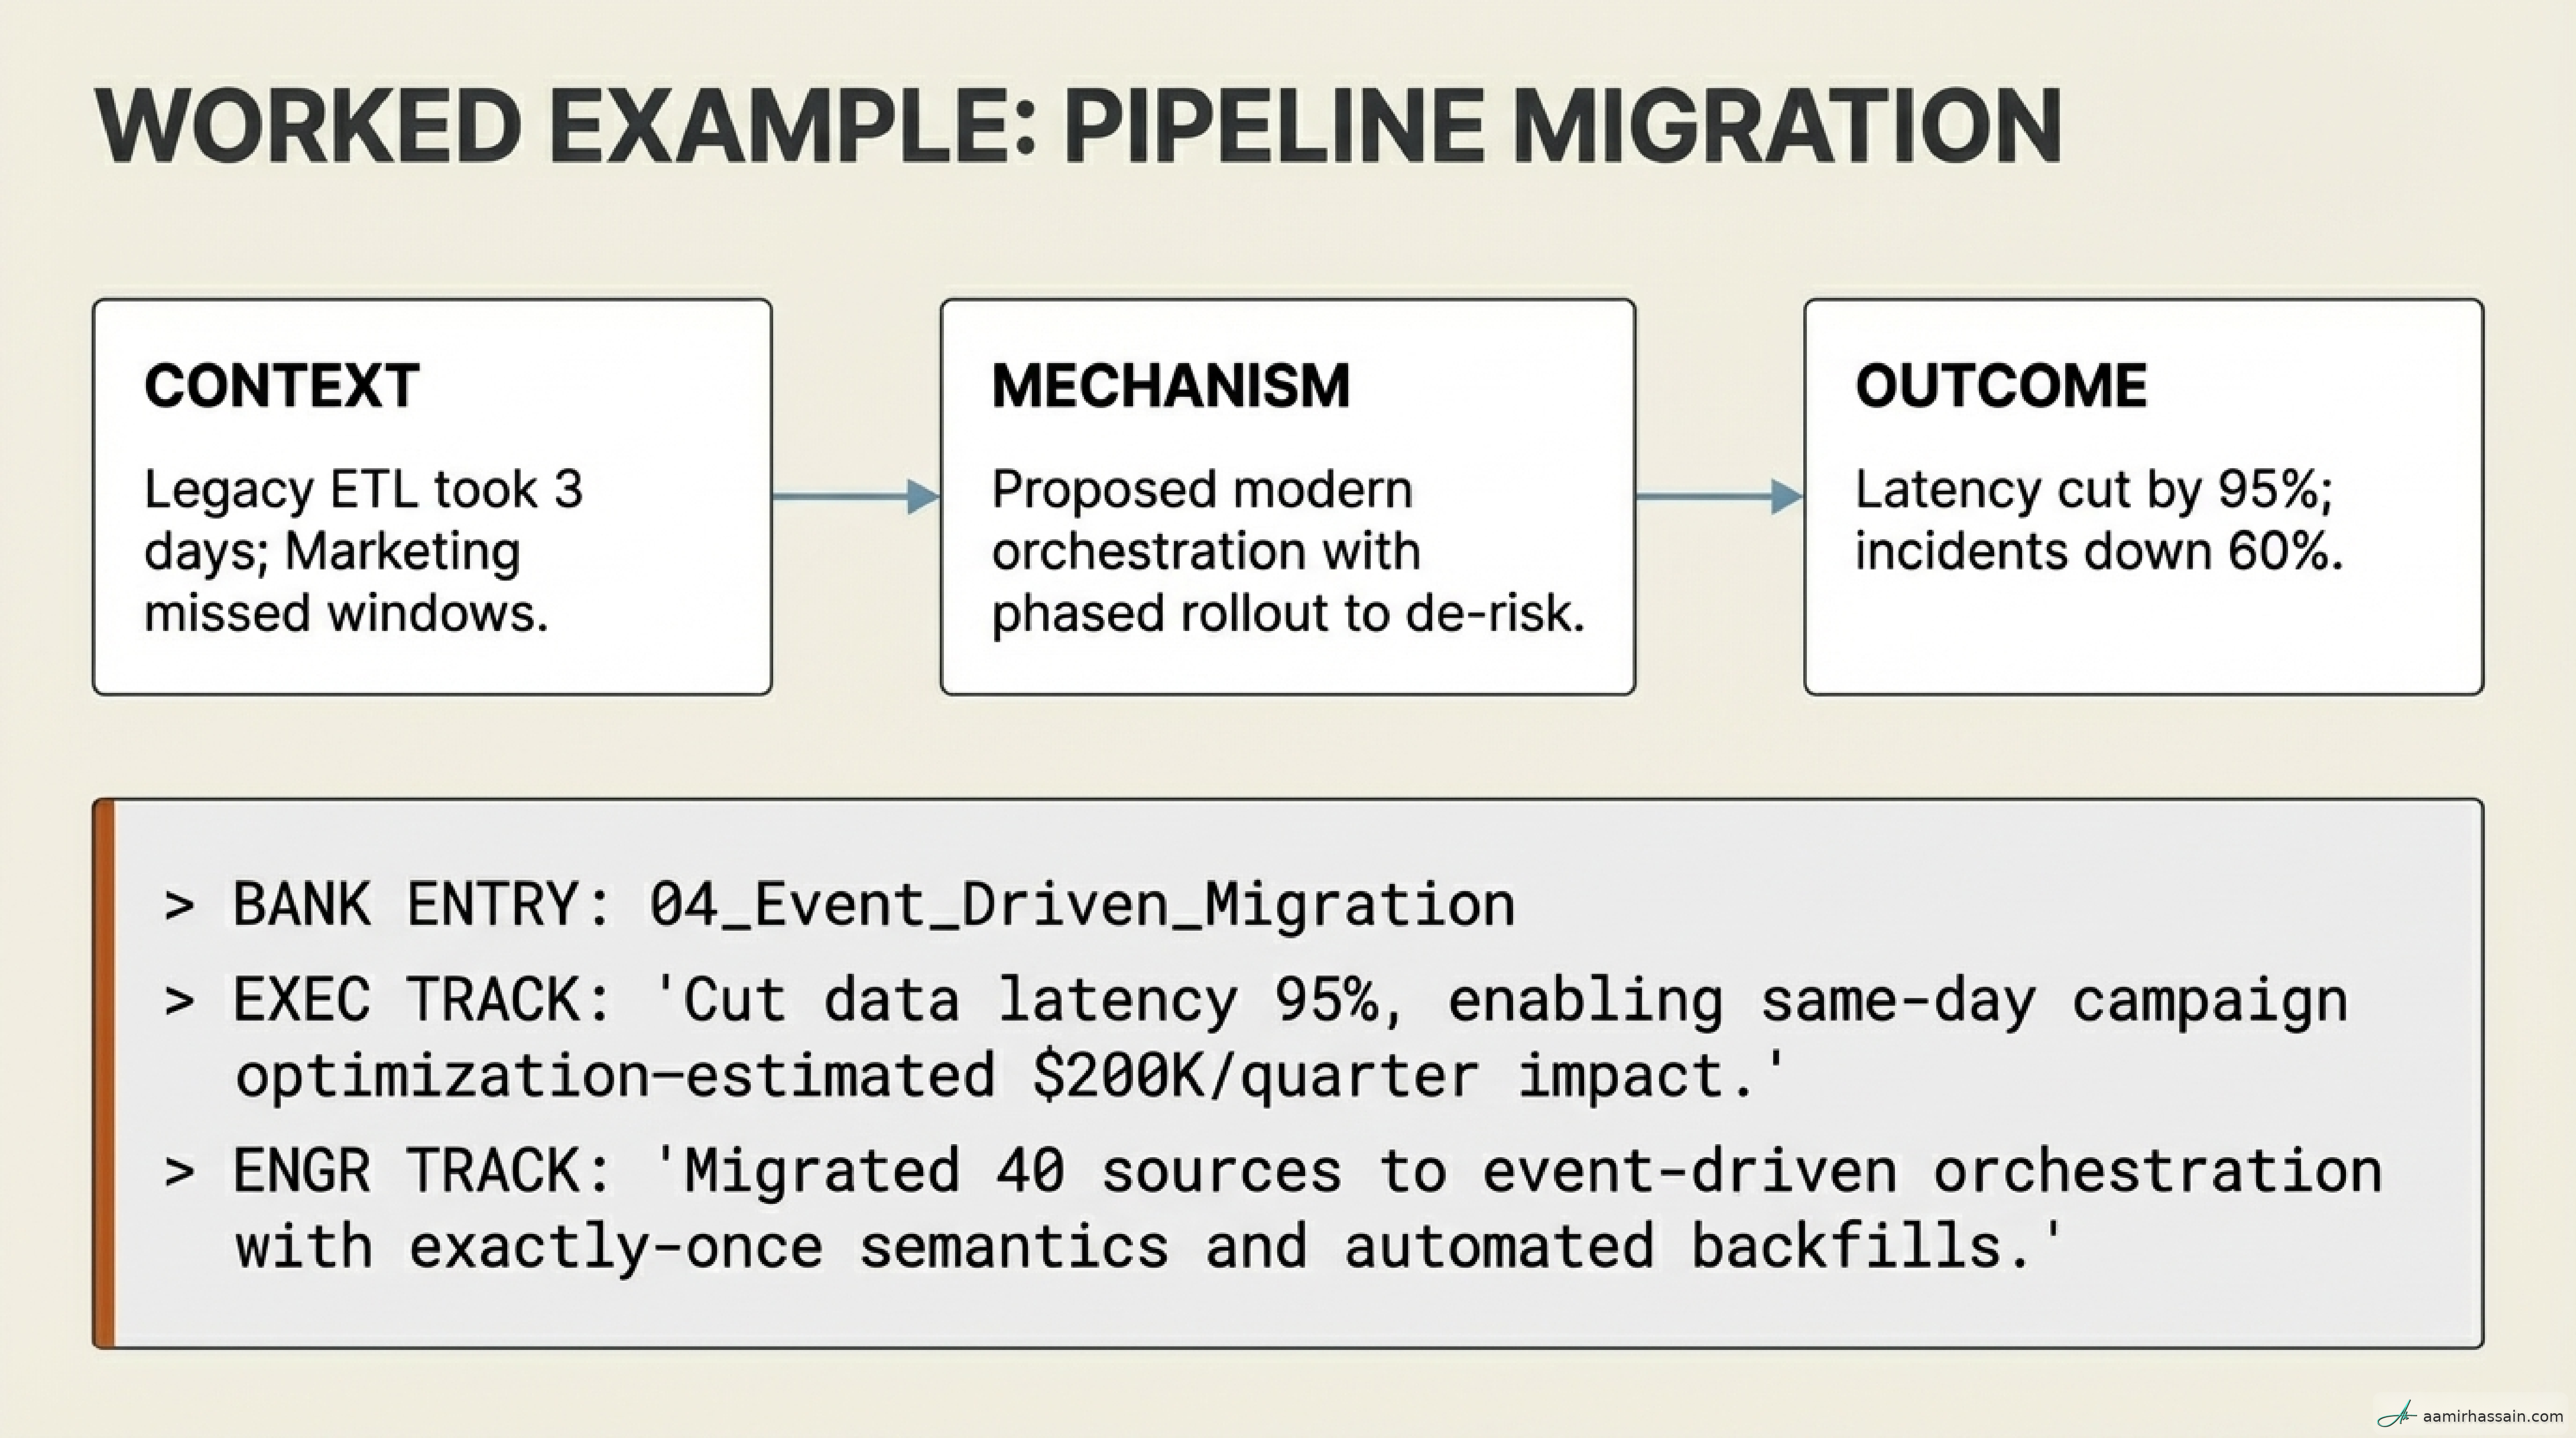
Worked Example: The Pipeline Migration#
When a VP asks about your quarterly accomplishments, move past the mechanism and focus on the decision and the result.
- Title: Pipeline Migration to Modern Orchestration
- Category: Time-to-Data, Reliability
- Context: Legacy ETL took 3 days to deliver campaign data; Marketing couldn’t act in time.
- Decision: I proposed the migration to a modern orchestration platform and led the phased rollout to de-risk adoption.
- Action: Led architecture design; piloted with 2 sources; scaled to 40 sources.
- Result: Time-to-data reduced from 3 days to 4 hours (95% reduction). Incidents down 60%.
- Learning: In the future, I would run parallel systems longer to catch edge cases earlier.
The two versions of the same story:
- The Exec Version (Business Value): “We cut data latency by 95% and reduced incidents by 60%. Marketing can now optimize campaigns on the same day, resulting in an estimated revenue impact of $200K per quarter through faster optimization and strategic flexibility.”
- The Engineer Version (Technical Depth): “I led the migration of 40 sources to event-driven orchestration using a new mechanism for exactly-once semantics and automated backfills to replace our legacy ETL debt.”
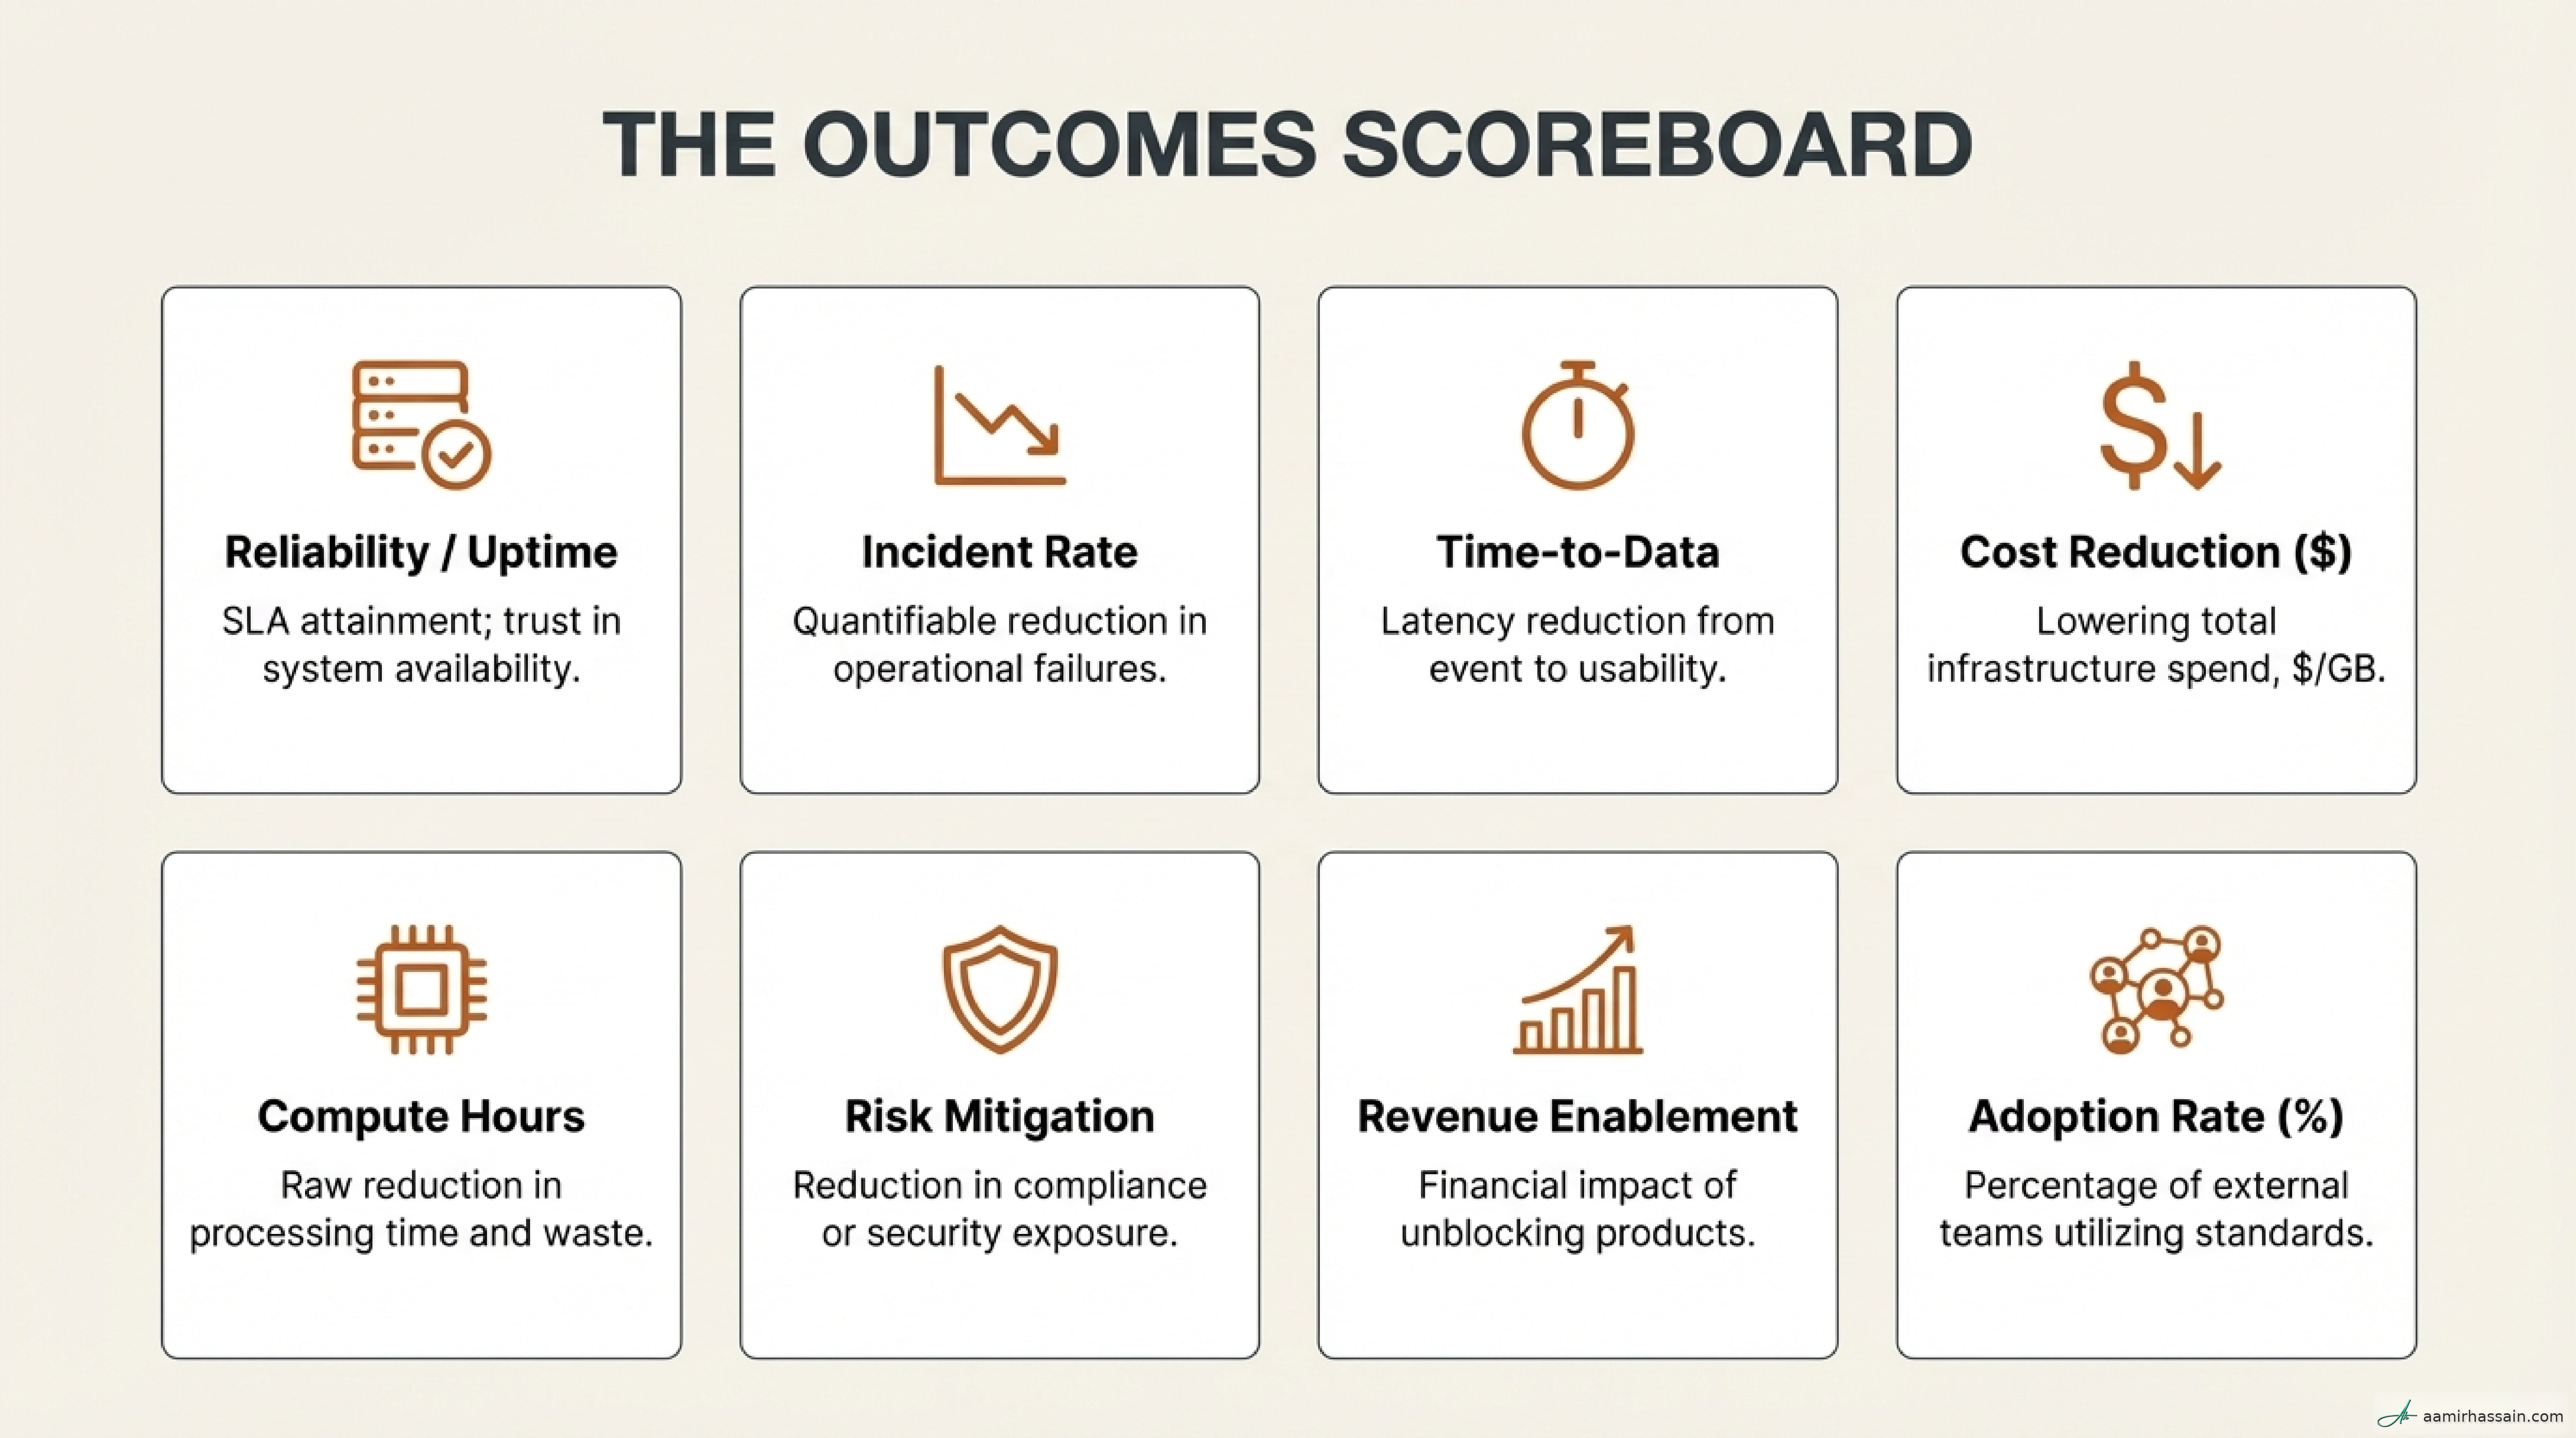
Metrics That Prove It: The Outcomes Scoreboard#
Use these metrics to make your narratives objective and credible:
- Time-to-data: Measures decision speed and organizational agility. Direction: decrease.
- Incident rate: Measures system trust and operational stability. Direction: decrease.
- SLA attainment: Proves reliability and commitment to stakeholders. Direction: increase.
- $/query or $/GB: Measures unit cost efficiency and scalability. Direction: decrease.
- Adoption rate (%): Measures platform enablement and influence. Direction: increase.
- Engineer focus time: Measures reduction in toil and high-value capacity. Direction: increase.
- Revenue impact ($): Direct link to business growth and ROI. Direction: increase.
- Compliance risk ($): Measures avoided legal, security, or operational exposure. Direction: decrease.
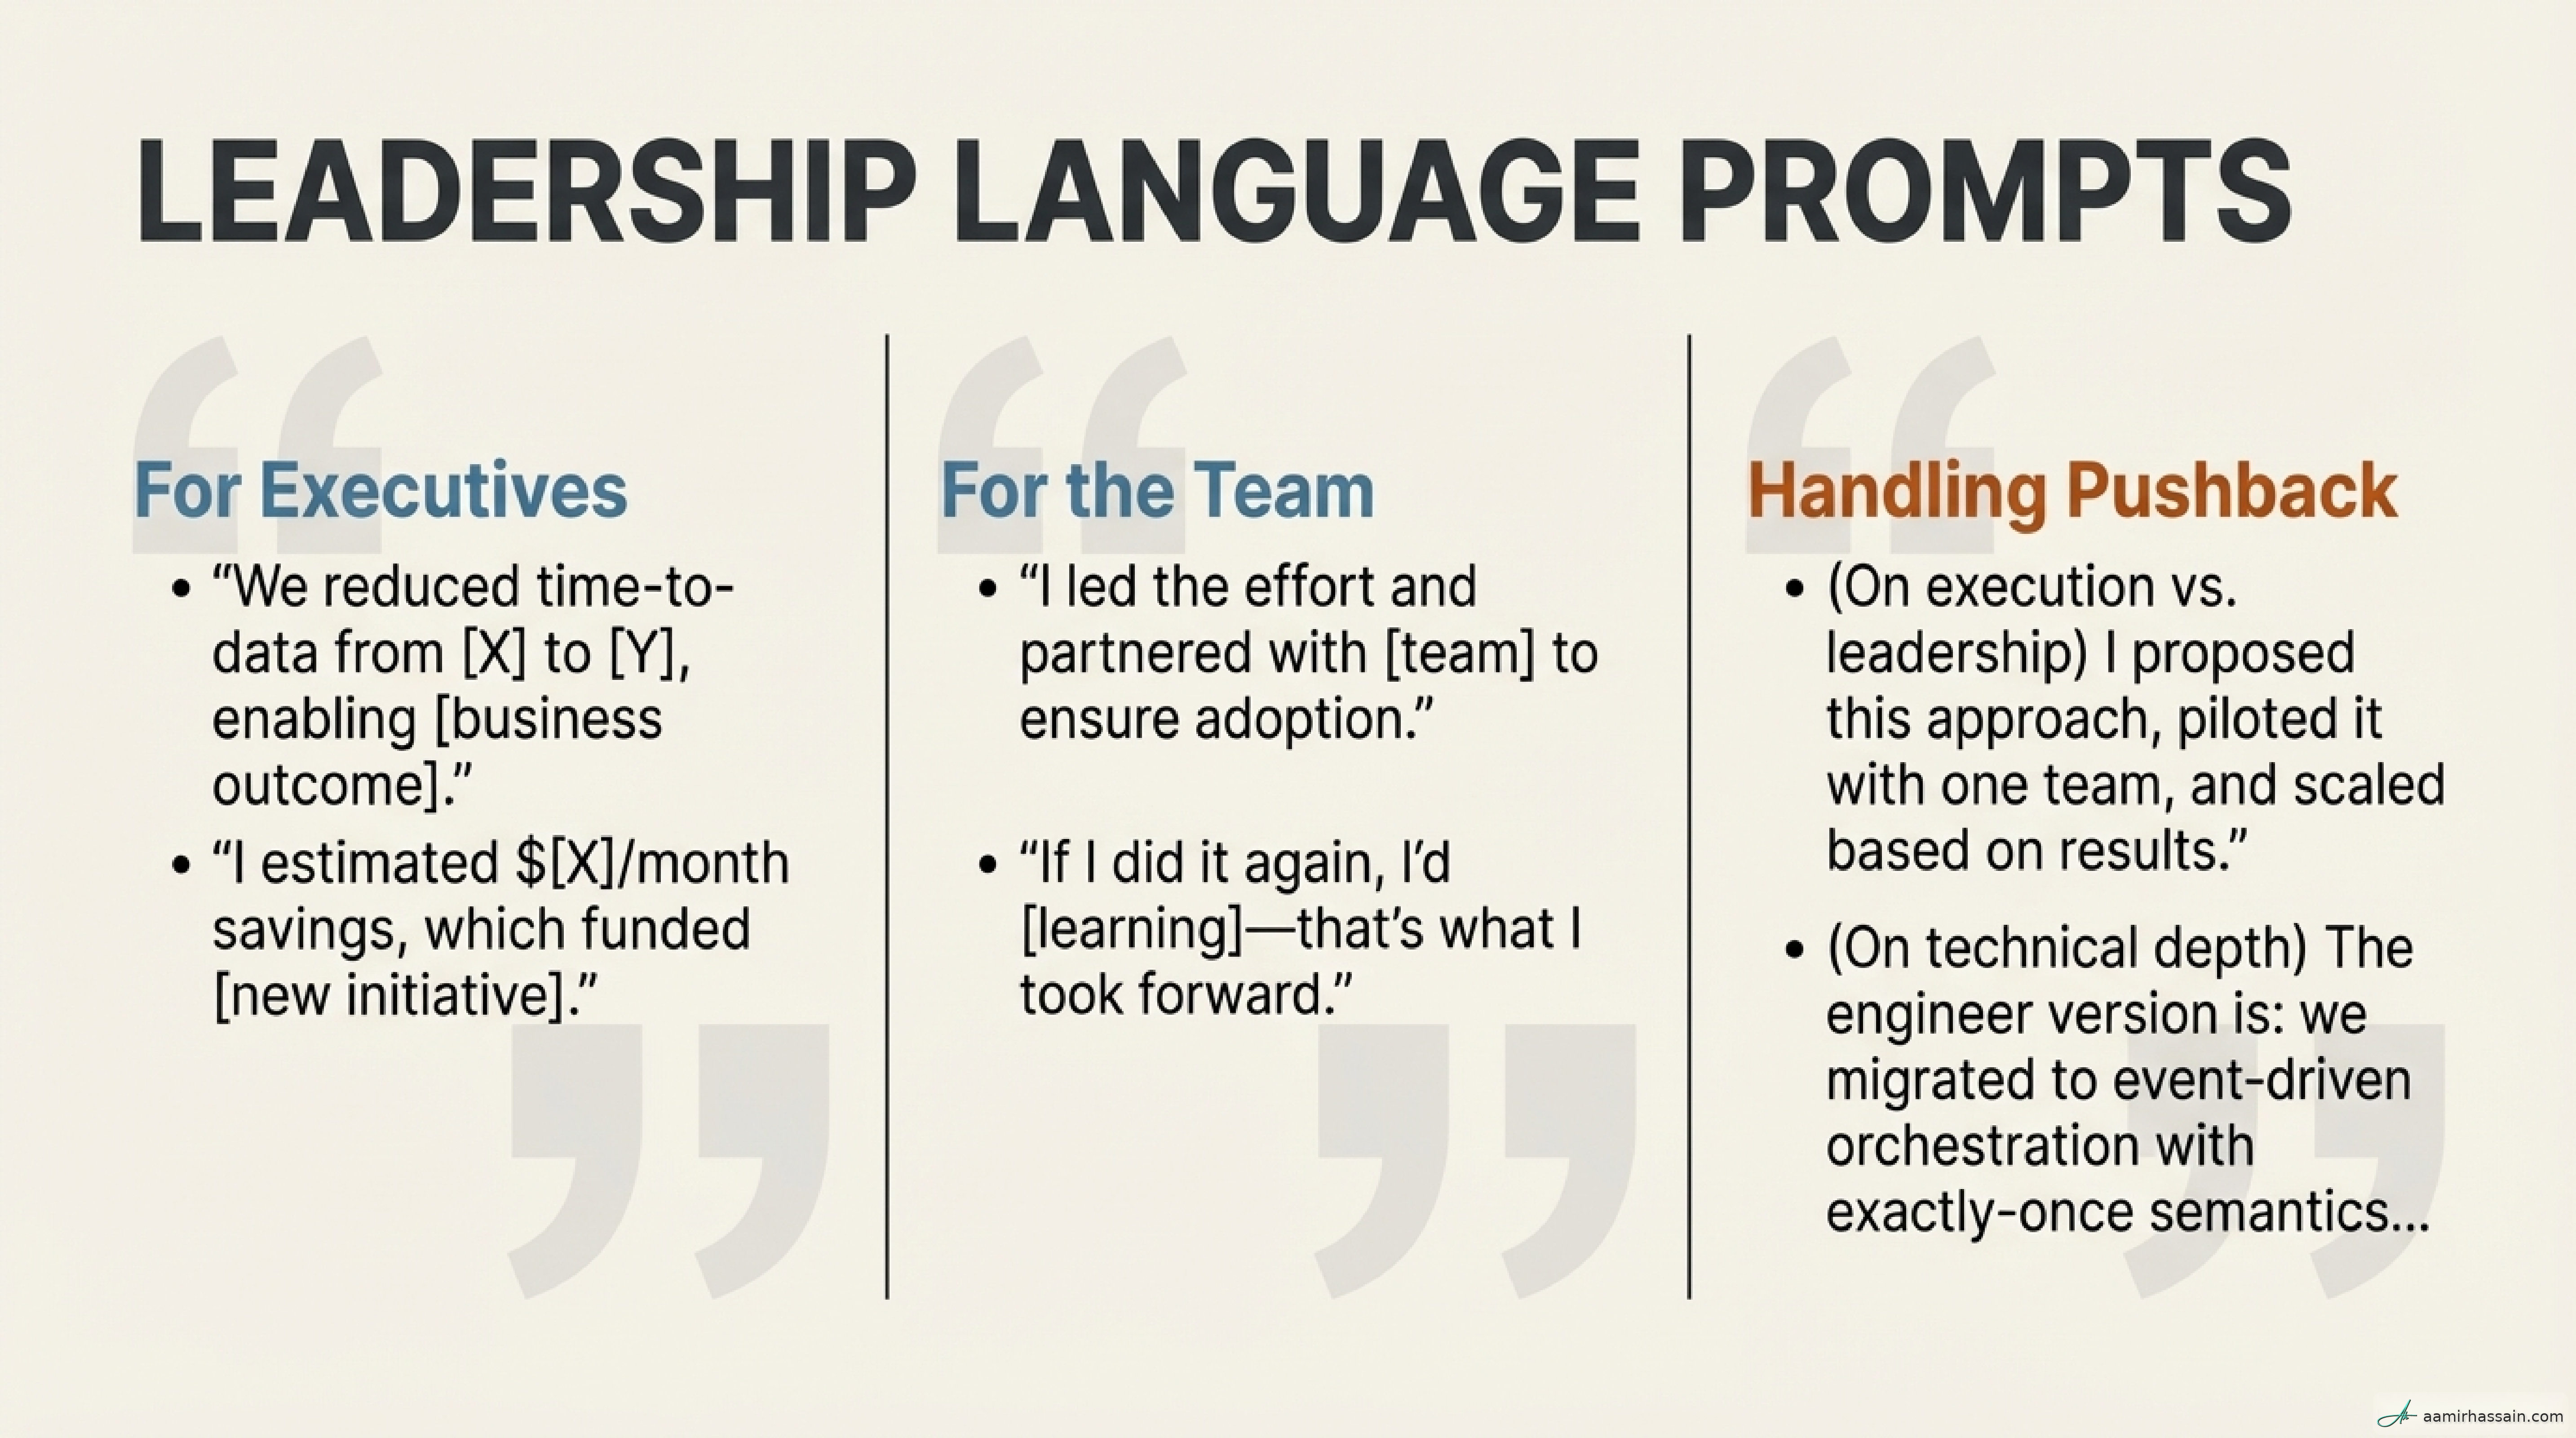
Leadership Language: Ready-Made Scripts#
Executive-Ready Scripts#
- “We reduced time-to-data from 3 days to 4 hours, enabling Marketing to act on campaign data immediately.”
- “Incident rates dropped 60%, freeing the team to focus on strategic product work instead of firefighting.”
- “I estimated $15k/month in infrastructure savings, which successfully funded our new AI initiative.”
- “This work mitigated a significant compliance risk by automating our data retention policies, preventing roughly $X in potential exposure.”
- “I proposed a contract-first approach that improved data trust and accelerated our decision cycles by 40%.”
Team-Ready Scripts#
- “We migrated to event-driven orchestration to handle 10x scalability for next year’s growth.”
- “I proposed this architecture because it manages the critical tradeoff between latency and compute cost.”
- “We implemented exactly-once semantics to ensure data consistency across our 40 diverse sources.”
- “I led the design of the automated backfill system specifically to reduce the manual toil during outages.”
- “The learning from this sprint is that we need longer parallel runs for legacy migrations to ensure schema parity.”
Pushback Scripts#
- “If we prioritize this tool request over the migration, we risk delaying the $200k/quarter revenue impact expected from the Marketing project.”
- “I am declining this implementation because it does not align with our current focus on cost optimization and reliability targets.”
- “We need clarity on the intended business outcome before we commit engineering capacity to this pipeline.”
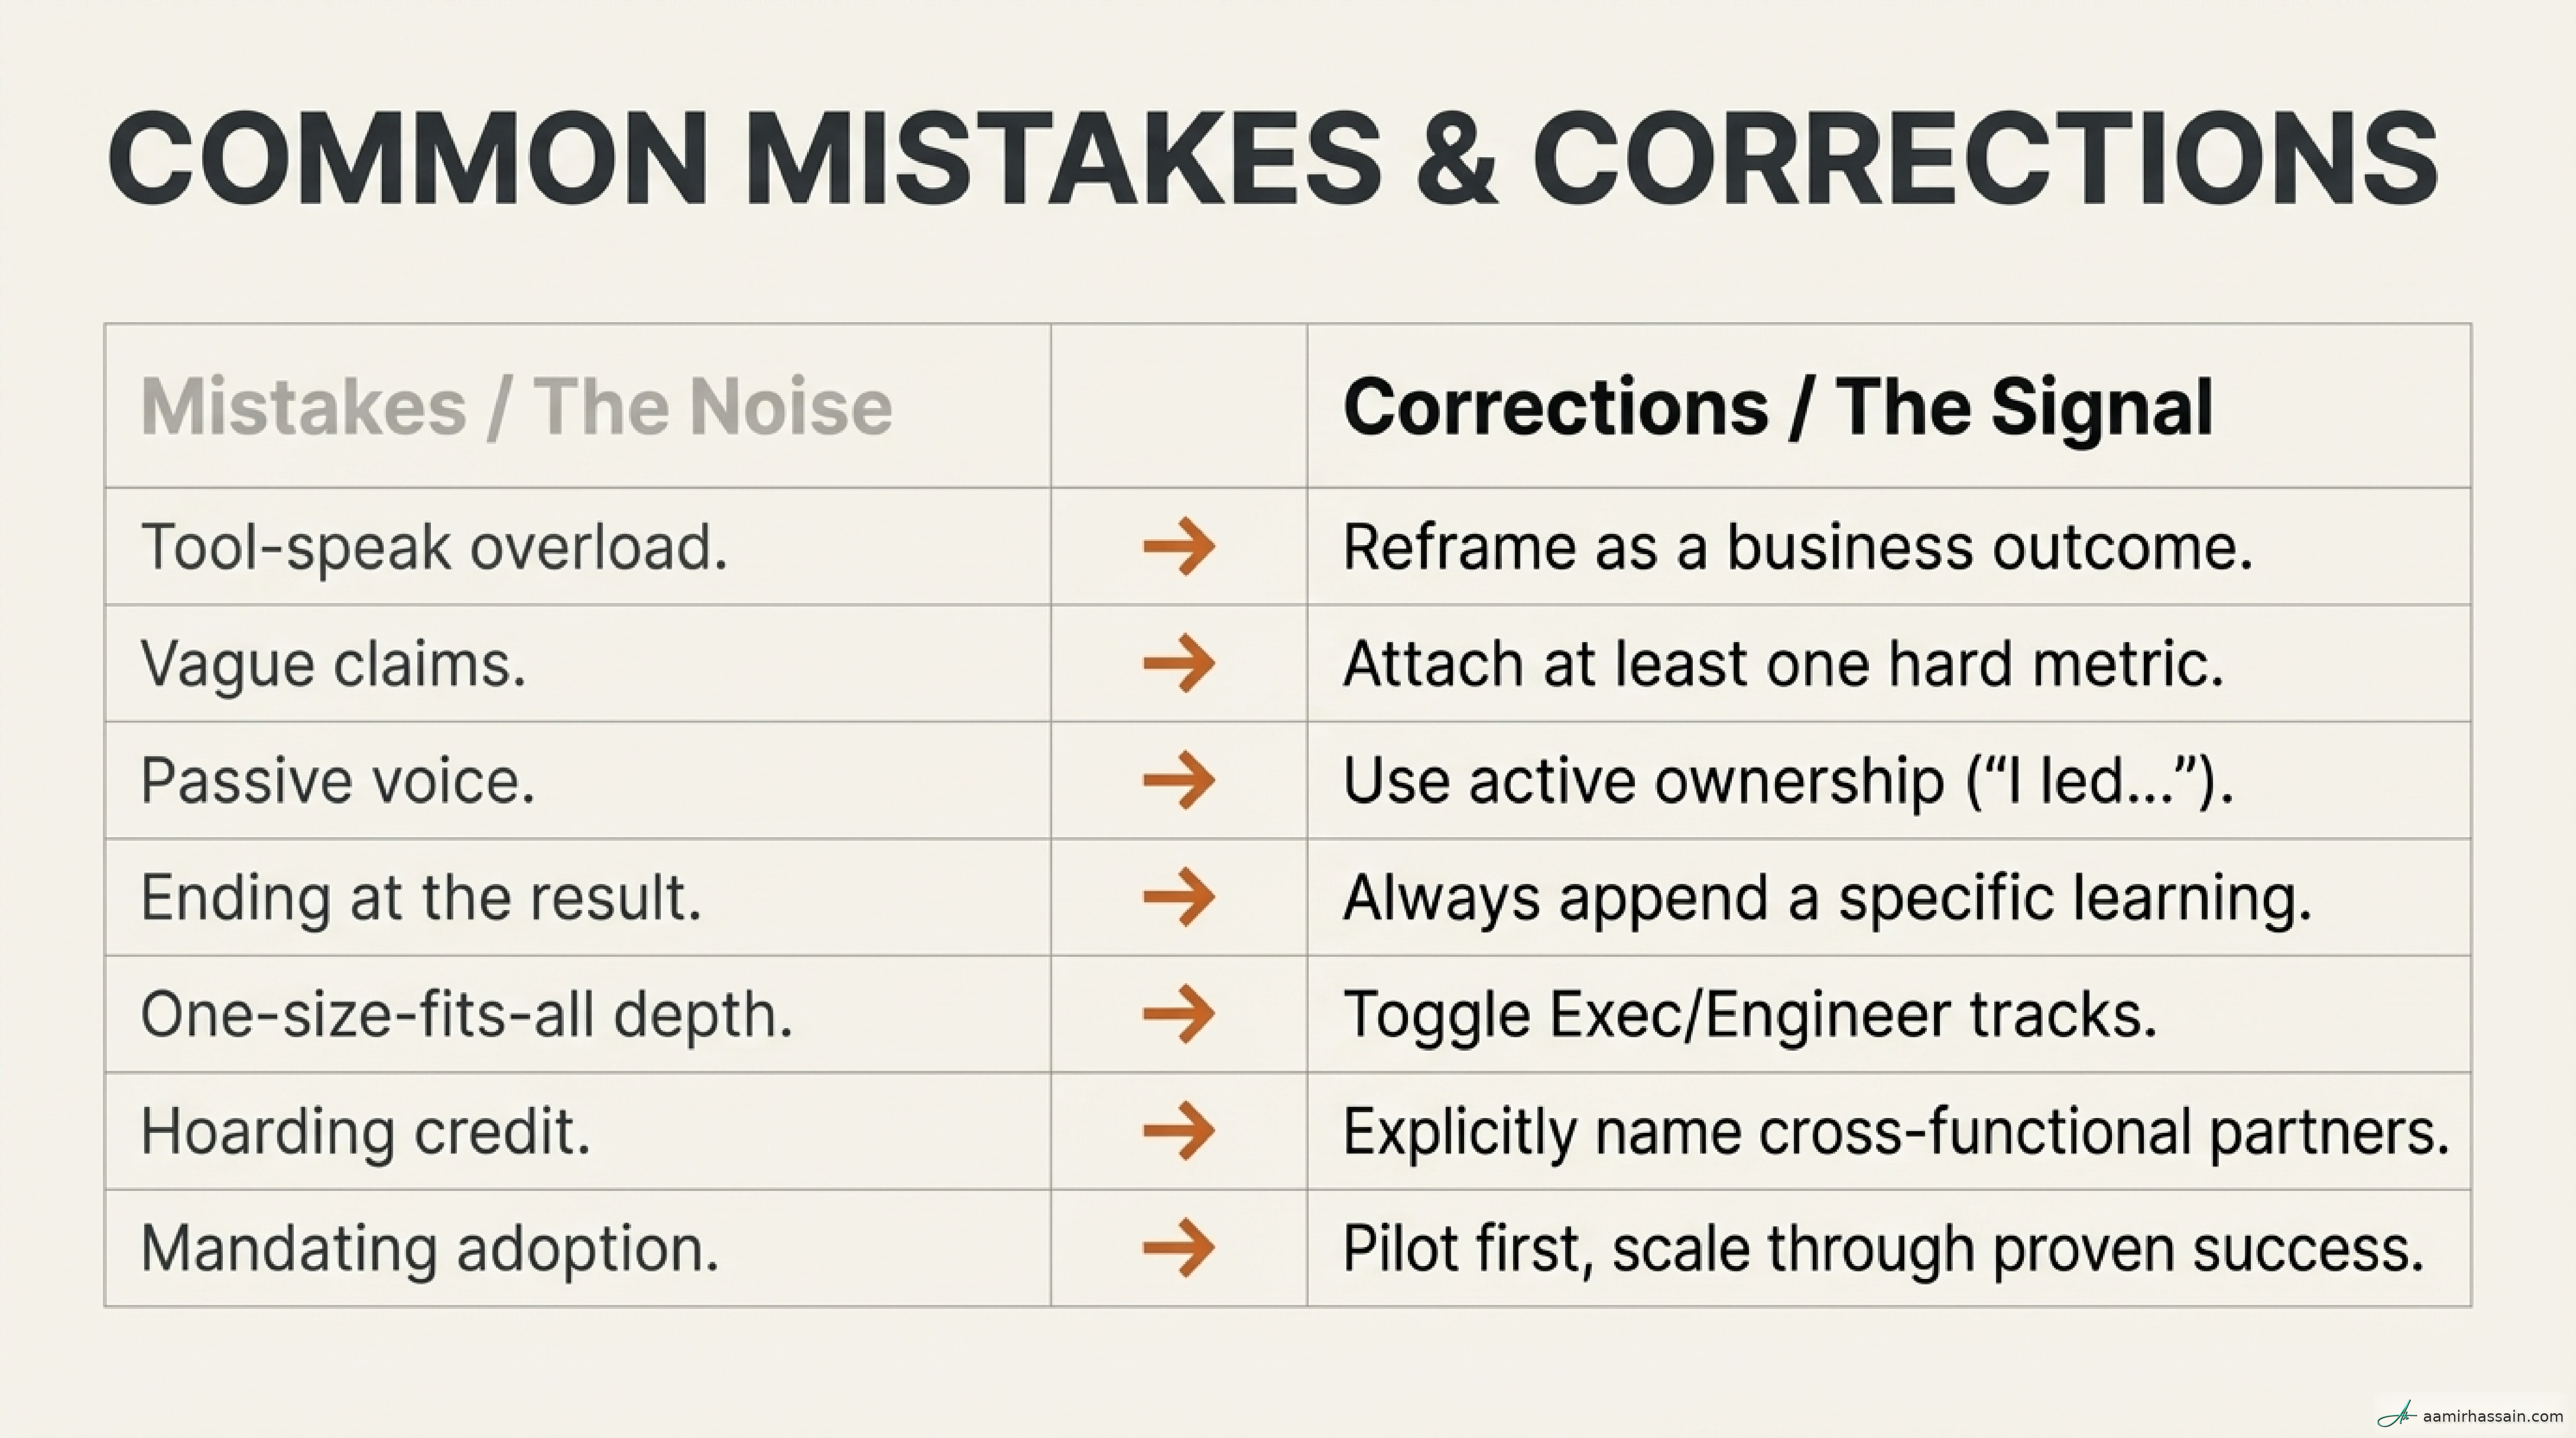
Common Mistakes to Avoid#
- Tool-speak overload: Leading with “I built Airflow DAGs.” Reframe as the outcome: “I reduced time-to-data…”
- Vague claims: Saying the system is “better” or “more stable” without proof. Attach a specific metric (%, $, hours, or incidents).
- Passive voice: Saying “The system was improved.” Use active voice: “I proposed and led the redesign…” to demonstrate ownership.
- No learnings: Ending the story at the result. Add what you took forward to demonstrate a growth mindset and senior-level reflection.
- One-size-fits-all depth: Using technical jargon with executives. Prepare two versions of every major win—an exec summary and a technical deep-dive.
- Leading with the fix: Describing the patch rather than the risk. Quantify the risk avoided in dollars (e.g., “$X exposure prevented”).
Next Steps#
- Start your Impact Narrative Bank: Draft 3 recent wins using the Context → Decision → Action → Result → Learning pattern.
- Audit your metrics: Ensure every win in your bank has at least one number attached (%, $, or time).
- Review your next stakeholder update: Remove all tool-speak and lead with the business problem solved.
- Partner with a peer: Draft your “Exec Version” for your most complex technical project and ask if the value is clear in two sentences.
Leadership in the data space is defined by the outcomes you enable, not the tools you deploy. By adopting an impact narrative, you transition from a technology implementer to a strategic partner. You ensure that when the business looks at the data platform, they don’t see a cost center—they see a revenue and efficiency engine.
How do you want your team’s legacy to be defined: by the tools you maintained, or by the business transformations you led?